 Global| Jan 26 2006
U.S. Durable Goods Orders Recover
by:Tom Moeller
|in:Economy in Brief
Summary
Orders for durable goods in December rose 1.3% following an upwardly revised 5.4% increase in November. The rise about matched Consensus expectations for a 1.0% gain, however, the details of the report painted a more constructive [...]
Orders for durable goods in December rose 1.3% following an upwardly revised 5.4% increase in November. The rise about matched Consensus expectations for a 1.0% gain, however, the details of the report painted a more constructive picture of factory sector activity than was portrayed in the November release.
Aircraft & parts orders which rose 77% and 69% in October & November, respectively, and dominated those two months' reports fell just 2.9% and were triple the year earlier level in December.
Moving in the other direction, new orders for motor vehicles & parts rose 6.6% (-1.3% y/y) following two months of sharp decline.
Less the transportation sector altogether, durable goods orders rose 0.9% following an upwardly revised 0.6% November increase.
Machinery orders rose 6.5% (10.9% y/y) after a 3.1% November increase, initially reported as a decline. Fabricated metals orders rose 1.3% (3.2% y/y) following a 1.6% November decline that was shallower than initially reported and orders for computers & related products rose 1.5% (8.0% y/y) after an upwardly revised 8.1% November increase.
Orders for nondefense capital goods fell 0.6% due to the drop in aircraft but less aircraft, nondefense capital goods orders increased 3.5% after a slight November increase that initially was reported as a 2.0% drop.
On the downside in December were communications equipment orders which fell 3.3% (-7.4% y/y) and electrical equipment orders which fell 2.8% (+14.8% y/y).
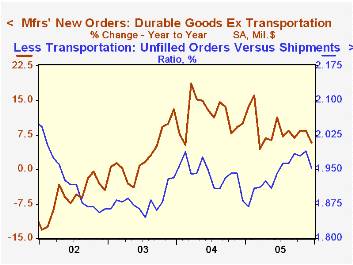
Shipments of durable goods jumped 3.5% (6.7% y/y) in December following a 0.6% November increase. Less the transportation sector, shipments rose 2.3% (6.0% y/y) after an upwardly revised 0.5% November increase.
Order backlogs surged another 2.4% (16.3% y/y) due to the high level of aircraft orders. Less transportation backlogs ticked up 0.3% (10.0% y/y) and the ratio of backlogs to shipments outside of transportation fell from the November high.
Durable inventories ticked 0.1% higher (3.5% y/y) after an upwardly revised 0.8% November increase.
| NAICS Classification | Dec | Nov | Y/Y | 2005 | 2004 | 2003 |
|---|---|---|---|---|---|---|
| Durable Goods Orders | 1.3% | 5.4% | 12.7% | 8.5% | 9.5% | 4.1% |
| Excluding Transportation | 0.9% | 0.6% | 5.8% | 8.5% | 11.7% | 3.1% |
| Nondefense Capital Goods | -0.6% | 22.2% | 31.3% | 19.7% | 11.0% | 4.2% |
| Excluding Aircraft | 3.5% | 0.2% | 7.0% | 10.6% | 9.5% | 4.8% |
by Tom Moeller January 26, 2006

Initial claims for unemployment insurance ticked 11,000 higher to 283,000 following a little revised 36,000 decline the prior week. Consensus expectations had been for 305,000 claims.
During the last ten years there has been a (negative) 75% correlation between the level of initial jobless insurance claims and the m/m change in payroll employment.
The four-week moving average of initial claims fell further to 288,750 (-14.1% y/y), its lowest level since June 2000.
Continuing unemployment insurance claims increased 53,000 following a deepened 154,000 decline the prior week.
The insured rate of unemployment held at 2.0% for the second week.
| Unemployment Insurance (000s) | 01/21/06 | 01/14/06 | Y/Y | 2005 | 2004 | 2003 |
|---|---|---|---|---|---|---|
| Initial Claims | 283 | 272 | -11.8% | 332 | 343 | 402 |
| Continuing Claims | -- | 2,581 | -7.0% | 2,663 | 2,924 | 3,532 |
by Carol Stone January 26, 2006
The Bank for International Settlements today reported international banking statistics for Q3 2005, on a provisional basis. These data are contained in Haver's BIS database, which includes basically all the tables in the BIS Quarterly Review. The objective of this highly detailed data collection effort is to provide indications of the exposure of reporting countries' banking systems to international developments. There are 39 reporting countries whose central banks provide comprehensive data on gross external assets and liabilities of their nation's banks with immediate borrowers. These reporting countries are mostly developed countries, but banks in emerging economies, such as Brazil, Mexico and Turkey, also report, along with a number of offshore banking centers. Claims and liabilities are classified by country and sector of the counter-party, by currency and by type of instrument, among other features. Of these 39 countries, 30 also report "consolidated" data, which net out inter-bank flows and indicate the amount of "ultimate" risk, including derivatives as well as on-balance-sheet items. In the following discussion, we look simply at the total of gross claims -- or assets -- for Q3 held by banks in various countries and the distribution of the so-called "vis-à-vis" countries which have incurred them.
At the end of September, external claims of banks in the 39 reporting countries totaled $20.713 trillion. This compares with $20.268 trillion on June 30 and $19,198.3 billion at the end of 2004. The largest claims are assets of banks in the UK, $4.122 trillion. The US is third in this ranking, having $1.965 trillion in foreign assets, while Germany is second at $2.184 trillion. Banks in Japan, France and the Cayman Islands all have more than $1.0 trillion in external assets.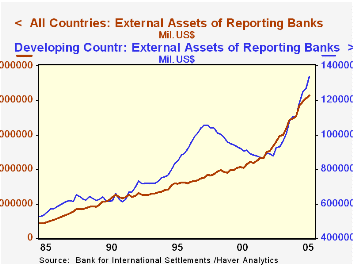
Frequently, in considering banking figures such as these, the public tends to focus on the debts of developing or emerging market countries. But, as measured here, these are smaller than might be expected: BIS reporting banks' assets in these countries came to only $1.338 trillion, 6.5% of the total. In an absolute sense, of course, $1.3 trillion is a large amount, and it probably carries more risk than the substantially bigger assets in more developed countries. The largest claims in this group of countries involve China and South Korea.
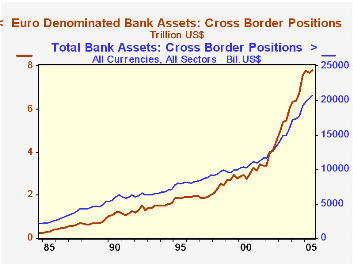
By type, loans constitute about three-quarters of these banking system assets. By currency, US dollar assets totaled $8.435 trillion on September 30. The next biggest currency is the euro, with $7.798 trillion. Non-trivial amounts are also denominated in yen, pounds and Swiss francs.
This is a quarterly release, with year-end 2005 likely to be released on April 25. The BIS established these reports as the eurocurrency markets developed in the 1970s. They were enhanced following significant international incidents, especially including the original Mexican debt crisis in 1983 and the Russian default in 1998.
| BIS (All Data in Trillions US $) |
Q3 2005 | Q2 2005 | Q1 2005 | Year-End|||
|---|---|---|---|---|---|---|
| 2004 | 2003 | 2002 | ||||
| Total | 20.713 | 20.268 | 19.808 | 19.198 | 15.999 | 13.370 |
| UK Bank Assets | 4.122 | 4.031 | 3.974 | 37.87 | 3.093 | 2.514 |
| German Bank Assets | 2.184 | 2.167 | 2.191 | 2.151 | 1.786 | 1.384 |
| Claims on Developed Countries | 16.372 | 16.038 | 15.765 | 15.206 | 12.714 | 10.619 |
| Claims on Developing Countries | 1.338 | 1.266 | 1.251 | 1.180 | 1.007 | 0.877 |
| US Dollar Denominated | 8.435 | 8.197 | 7.662 | 7.356 | 6.362 | 5.664 |
| Euro Denominated (US$ value) | 7.798 | 7.663 | 7.760 | 7.564 | 6.026 | 4.501 |

Tom Moeller
AuthorMore in Author Profile »Prior to joining Haver Analytics in 2000, Mr. Moeller worked as the Economist at Chancellor Capital Management from 1985 to 1999. There, he developed comprehensive economic forecasts and interpreted economic data for equity and fixed income portfolio managers. Also at Chancellor, Mr. Moeller worked as an equity analyst and was responsible for researching and rating companies in the economically sensitive automobile and housing industries for investment in Chancellor’s equity portfolio. Prior to joining Chancellor, Mr. Moeller was an Economist at Citibank from 1979 to 1984. He also analyzed pricing behavior in the metals industry for the Council on Wage and Price Stability in Washington, D.C. In 1999, Mr. Moeller received the award for most accurate forecast from the Forecasters' Club of New York. From 1990 to 1992 he was President of the New York Association for Business Economists. Mr. Moeller earned an M.B.A. in Finance from Fordham University, where he graduated in 1987. He holds a Bachelor of Arts in Economics from George Washington University.
More Economy in Brief


