 Global| Jan 28 2010
U.S. Durable Goods Orders'Improvement Abates
by:Tom Moeller
|in:Economy in Brief
Summary
The pace of improvement in factory sector activity eased after material improvement early last year. Durable goods orders during December provided another indication of a slower rate of gain with a 0.3% increase following two months [...]
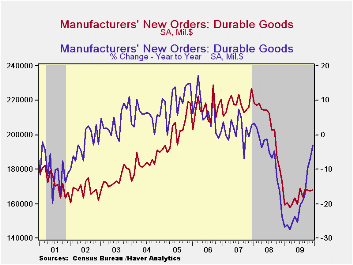 The pace of improvement in factory sector activity eased after
material improvement early last year. Durable goods orders during
December provided another indication of a slower rate of gain with a
0.3% increase following two months of modest declines which were
revised lower. A 2.0% December increase had been the Consensus
expectation. The recently flat orders pattern nevertheless left orders
6.3% above the March low. For all of last year, orders fell 19.9%
following a 6.0% drop during 2008.
The pace of improvement in factory sector activity eased after
material improvement early last year. Durable goods orders during
December provided another indication of a slower rate of gain with a
0.3% increase following two months of modest declines which were
revised lower. A 2.0% December increase had been the Consensus
expectation. The recently flat orders pattern nevertheless left orders
6.3% above the March low. For all of last year, orders fell 19.9%
following a 6.0% drop during 2008.
Transportation sector orders provided much of the shortfall
during the last two months with 2.0% and 8.1% declines. 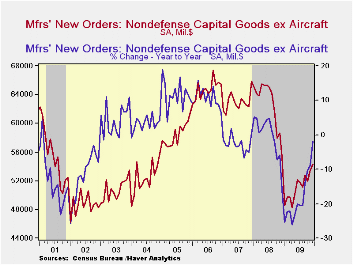 These were led
by sharply lower orders for nondefense aircraft & parts which
fell by one-half during all of last year after a one-third 2008
decline. New orders for motor vehicles & parts improved
slightly during the second half of 2009 but were off by one-quarter for
the year.
These were led
by sharply lower orders for nondefense aircraft & parts which
fell by one-half during all of last year after a one-third 2008
decline. New orders for motor vehicles & parts improved
slightly during the second half of 2009 but were off by one-quarter for
the year.
Primary metals orders improved sharply during the second half of last year but still were off by one-third for 2009. Machinery orders also improved steadily during the second half but fell 25% for the year as a whole. Electrical equipment orders were volatile m/m and fell 19.1% for the year. Orders for computers & related equipment also showed sketchy improvement late in the year but nevertheless fell 10.6% for 2009 overall.
Capital goods orders ended 2009 on a firm note. Nondefense capital goods orders less aircraft rose 1.3% (-2.0% y/y) and rose 12.3% from the April low.
Shipments of durable goods jumped 2.9% during December (-3.9% y/y) and firmed by 7.2% during the second half of 2009. Shipments of primary metals have been notably strong (2.0% y/y) logging a one-third increase since mid-year. Machinery shipments also firmed late in the year (-16.0% y/y) as did electrical equipment shipments (-8.4% y/y).
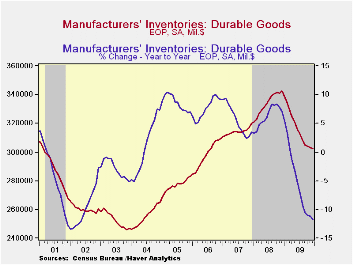
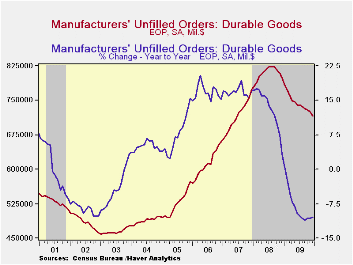
Perhaps the factory sector's inventory cycle is ending but it's not over. Durable goods inventories slipped 0.2% during December (-11.3% y/y) after similar declines during the prior two months. These declines followed monthly drops between 1.0% and 1.7% during the first nine months of the year. As a result of the decumulation the ratio of inventories-to-shipments was at its lowest since October of 2008, off sharply from the January high.. The pace of the decline in unfilled orders accelerated at a yearend with a 1.2% drop (-10.4% y/y) after a 0.7% November decline. The transportation sector saw the largest shortfall (-11.7% y/y). Less transportation, backlogs were roughly unchanged during the last three months of 2009 (-8.7% y/y).
| NAICS Classification (%) | December | November | October | Y/Y | 2009 | 2008 | 2007 |
|---|---|---|---|---|---|---|---|
| Durable Goods Orders | 0.3 | -0.4 | -0.1 | -3.1 | -19.9 | -6.0 | 1.4 |
| Excluding Transportation | 0.9 | 2.1 | -0.5 | 0.5 | -17.4 | -1.4 | -0.3 |
| Nondefense Capital Goods | -0.2 | -3.0 | 2.0 | -2.2 | -24.0 | -7.0 | 3.6 |
| Excluding Aircraft | 1.3 | 3.1 | -1.8 | -2.0 | -18.3 | -0.5 | -2.7 |
by Tom Moeller January 28, 2010
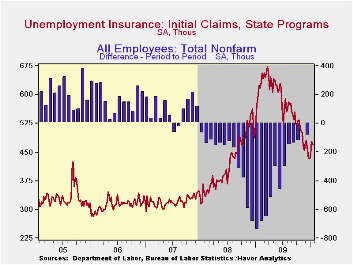 The Labor
Department reported that initial claims for jobless insurance slipped
8,000 to 470,000 following strong increases during the prior two weeks.
Despite the earlier increases, claims remained near the lowest level
since late August, 2008 and were down from the recession peak of
674,000 hit last March. Consensus expectations had been for 450,000
claims. The weekly gains raised the four-week moving average of initial
claims to 456,250 .which remained near the cycle low.
The Labor
Department reported that initial claims for jobless insurance slipped
8,000 to 470,000 following strong increases during the prior two weeks.
Despite the earlier increases, claims remained near the lowest level
since late August, 2008 and were down from the recession peak of
674,000 hit last March. Consensus expectations had been for 450,000
claims. The weekly gains raised the four-week moving average of initial
claims to 456,250 .which remained near the cycle low.
Continuing claims for unemployment insurance during the latest week fell sharply to a new cycle low. The 57,000 drop reversed all of the prior week's increase and claims were down by one-third since late-June. Continuing claims were at the lowest level since mid-January of last year. The overall decline is a function of the improved job market but also reflects the exhaustion of 26 weeks of unemployment benefits. Continuing claims provide an indication of workers' ability to find employment. The four-week average of continuing claims fell to 4,669,250. This series dates back to 1966.
Extended benefits for unemployment insurance slipped to another cycle low of 261,962 during the second week of January and were down by more than one-half from a peak of 597,688 reached in November.
The
insured rate of unemployment also fell to a new low of 3.5%. The rate
reached a high of 5.2% during late-June. 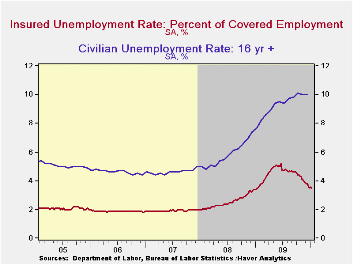 During the last ten years,
there has been a 93% correlation between the level of the insured
unemployment rate and the overall rate of unemployment published by the
Bureau of Labor Statistics. · The highest insured unemployment
rates in the week ending January 2 were in Wisconsin (7.3 percent),
Alaska (7.1), Pennsylvania (6.9), Idaho (6.8), Michigan (6.2), North
Carolina (6.1), Montana (6.0), Washington (6.0) and Connecticut (5.8).
The lowest insured unemployment rates were in Virginia (2.5), Texas
(2.6), Florida (3.4), Wyoming (3.6), Maryland (3.8), Maine
(4.0), Ohio (4.1), New York (4.5) and Mississippi (4.4). These data are
not seasonally adjusted but the overall insured unemployment rate is.
During the last ten years,
there has been a 93% correlation between the level of the insured
unemployment rate and the overall rate of unemployment published by the
Bureau of Labor Statistics. · The highest insured unemployment
rates in the week ending January 2 were in Wisconsin (7.3 percent),
Alaska (7.1), Pennsylvania (6.9), Idaho (6.8), Michigan (6.2), North
Carolina (6.1), Montana (6.0), Washington (6.0) and Connecticut (5.8).
The lowest insured unemployment rates were in Virginia (2.5), Texas
(2.6), Florida (3.4), Wyoming (3.6), Maryland (3.8), Maine
(4.0), Ohio (4.1), New York (4.5) and Mississippi (4.4). These data are
not seasonally adjusted but the overall insured unemployment rate is.
The unemployment insurance claims data is available in Haver's WEEKLY database and the state data is in the REGIONW database.
Labor Market Globalization in the Recession and Beyond from the Federal Reserve Bank of Dallas is available here.
| Unemployment Insurance (000s) | 1/23/10 | 1/16/10 | 1/09/10 | Y/Y | 2009 | 2008 | 2007 |
|---|---|---|---|---|---|---|---|
| Initial Claims | 470 | 478 | 444 | -20.3% | 573 | 419 | 321 |
| Continuing Claims | -- | 4,602 | 4,659 | -1.5% | 5,835 | 3,345 | 2,552 |
| Insured Unemployment Rate (%) | -- | 3.5 | 3.6 | 3.5 (1/2009) | 4.4 | 2.5 | 1.9 |
by Tom Moeller January 28, 2010
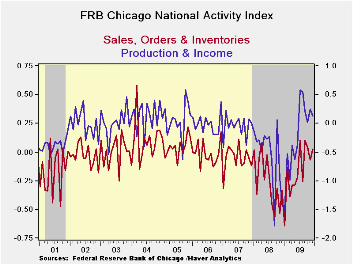
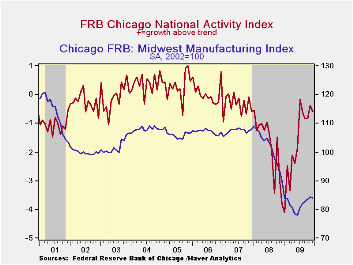 Forward
momentum in the U.S. economy recently stalled. After earlier
improvement, the Chicago Fed National Activity Index (CFNAI) from the
Federal Reserve Bank of Chicago slipped last month to a reading of
-0.61 and remained down from the July high. Nevertheless, the index
level remained up from the series' low of -4.09 reached this past
January. Since 1970 there has been a 74% correlation between the level
of the index and the q/q change in real GDP but during the last ten
years that correlation has risen to 80%.
Forward
momentum in the U.S. economy recently stalled. After earlier
improvement, the Chicago Fed National Activity Index (CFNAI) from the
Federal Reserve Bank of Chicago slipped last month to a reading of
-0.61 and remained down from the July high. Nevertheless, the index
level remained up from the series' low of -4.09 reached this past
January. Since 1970 there has been a 74% correlation between the level
of the index and the q/q change in real GDP but during the last ten
years that correlation has risen to 80%.
The three-month moving average which smoothes out some of the volatility of the index was roughly stable near its highest level since February of 2008.
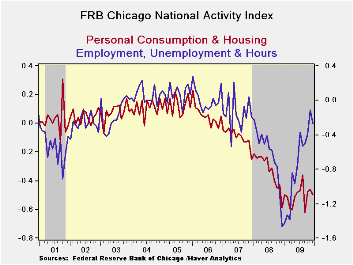
An index level at or below -0.70 typically has indicated negative U.S. economic growth. A zero value of the CFNAI indicates that the economy is expanding at its historical trend rate of growth of roughly 3%. The complete CFNAI report is available here.· The Chicago Fed indicated that 36 of the series' individual indicators made positive contributions to the November index while 49 made negative contributions. The CFNAI is a weighted average of 85 indicators of economic activity. The indicators reflect activity in the following categories: production & income, the labor market, personal consumption & housing, manufacturing & trade sales, and inventories & orders.
In a separate survey, the Chicago Fed indicated that its Midwest manufacturing index slipped during December but remained near its highest level of the year. Indicators for the auto, steel, machinery and resource sectors were roughly unchanged. The Chicago Federal Reserve figures are available in Haver's SURVEYS database.
| Chicago Fed | December | November | October | 2009 | 2008 | 2007 |
|---|---|---|---|---|---|---|
| CFNAI | -0.61 | -0.39 | -0.83 | -1.64 | -1.76 | -0.34 |
| 3-Month Moving Average | -0.61 | -0.68 | -0.76 | -- | -- | |
| Personal Consumption & Housing | -0.50 | -0.46 | -0.48 | -0.51 | -0.33 | -0.10 |
| Employment, Unemployment & Hours | -0.27 | -0.11 | -0.39 | -0.74 | -0.63 | -0.15 |
| Production & Income | 0.13 | 0.25 | 0.02 | -0.22 | -0.56 | -0.05 |
| Sales, Inventories & Orders | 0.03 | -0.07 | 0.04 | -0.17 | -0.25 | -0.06 |
by Robert Brusca January 28, 2010
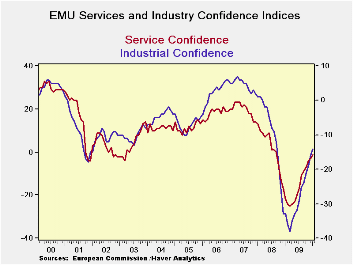
The EU indices rose in January improving to -13 from -16 for all of EU. All the large country indices improved on the month from Germany to France to Italy to Spain to the UK. While the EU Service index is the highest raw reading at -2 in January as a percentage of its range the reading only resides in the 46th percentile. Retailing, with a raw reading of -3, stands at a much stronger 71st percentile of its range. At -13 the industrial sector and consumer confidence metric stand in the 56th percentiles of their respective ranges.
To compare sectors look at the percentile ranking or at the ranking by queue in the third column from the right of the table instead of at the raw readings. Theses measures position each component as a percentile of its range or in a queue of past observations. Right now the range percentile readings are much higher than the queue percentiles. The sector readings have rebounded from the lower reaches of their ranges but are still ranked weakly compared to the more common habitat of those gauges when times are normalized. While the overall EU index stands in the 66th percentile of its range, at the edge of the top third of the range, when ranked by queue the reading is only in the bottom one third of that range. That means the over index is only weaker than the current reading one third of the time. That interpretation gives a much better understanding of how weak Europe still is.
The only truly strong queue percentile reading for EU is for retailing; that sector is stronger than its current rating only 29% of the time. All other sector readings are well below the 50% mark. Construction is in the bottom 14% by queue and services are in the bottom 19 percentile. These are still extremely weak readings.
By country Italy has the strongest queue percentile, and, at 51 percent, it is the only one above its midpoint. That means Italy is the closest to being back to normal. Next best is France in the 39th queue percentile. The worst off is Spain in the 15th percentile of its queue and then Germany in the 33rd percentile of its queue.
That is not surprising since Germany and Spain have the lowest statistical correlation to the overall EMU reading among large EMU member countries. Both are lagging in this cycle
On balance the results may not be what you expected to see. It is not the usual locomotive effect of the big two or three pulling away from the pack which rides on their coat-tails but rather Italy that is doing best by the queue measure and Spain being weakest, beset as it is with real estate problems that are usually slow to mend – can’t export your way out of a real estate problem. On a queue basis (probably the best way to look at it) Europe is still well away from a sort of a neutral reading on the EU Commission indices. On a range percentile basis the EU is already back above the mid point for the overall index and for all sectors except services and construction. The recovery, however, is weak as it is leaving Spain behind and Germany is a laggard, not a leader.
| EU sectors and country level overall sentiment | by
queue rank% |
r-sq
w/ Overall |
rank
of change |
||||||||||
|---|---|---|---|---|---|---|---|---|---|---|---|---|---|
| EU | Jan 10 |
Dec 09 |
Nov 09 |
Oct 09 |
%tile | rank | max | min | range | mean | |||
| Overall Index | 97.1 | 95 | 91.5 | 90 | 61.8 | 167 | 115 | 68 | 47 | 100 | 33.5% | 1.00 | 24 |
| Industrial | -13 | -16 | -19 | -20 | 56.5 | 179 | 7 | -39 | 46 | -8 | 28.7% | 0.90 | 3 |
| Consumer Confid |
-13 | -14 | -15 | -15 | 55.9 | 159 | 2 | -32 | 34 | -11 | 36.7% | 0.87 | 33 |
| Retail | -3 | -6 | -6 | -12 | 71.0 | 72 | 6 | -25 | 31 | -6 | 71.3% | 0.66 | 16 |
| Construction | -34 | -33 | -32 | -34 | 17.4 | 215 | 4 | -42 | 46 | -17 | 14.3% | 0.50 | 156 |
| Services | -2 | -2 | -9 | -11 | 46.0 | 129 | 32 | -31 | 63 | 13 | 19.4% | 0.89 | 65 |
| % m/m | Jan 10 |
Based on Level |
Level | ||||||||||
| EMU | 1.7% | 2.4% | 2.6% | 95.7 | 54.9 | 186 | 116 | 71 | 46 | 100 | 25.9% | 0.95 | 32 |
| Germany | 0.6% | 1.6% | 1.7% | 96.1 | 45.8 | 168 | 121 | 75 | 46 | 101 | 33.1% | 0.67 | 90 |
| France | 0.6% | 4.1% | 2.4% | 99.2 | 56.2 | 151 | 119 | 74 | 44 | 100 | 39.8% | 0.85 | 89 |
| Italy | 4.3% | 2.6% | 2.7% | 101.4 | 62.0 | 121 | 120 | 71 | 50 | 100 | 51.8% | 0.83 | 15 |
| Spain | 0.3% | 1.3% | 1.2% | 89.0 | 38.7 | 212 | 116 | 72 | 44 | 100 | 15.5% | 0.75 | 109 |
| Memo:UK | 3.4% | 6.9% | -2.6% | 98.2 | 65.9 | 160 | 115 | 65 | 50 | 100 | 36.3% | 0.56 | 41 |
| All since jan 1989 | 251-Count | 160 -Count | |||||||||||
| Sentiment is an index, sector readings are net balance diffusion measures | |||||||||||||

Tom Moeller
AuthorMore in Author Profile »Prior to joining Haver Analytics in 2000, Mr. Moeller worked as the Economist at Chancellor Capital Management from 1985 to 1999. There, he developed comprehensive economic forecasts and interpreted economic data for equity and fixed income portfolio managers. Also at Chancellor, Mr. Moeller worked as an equity analyst and was responsible for researching and rating companies in the economically sensitive automobile and housing industries for investment in Chancellor’s equity portfolio. Prior to joining Chancellor, Mr. Moeller was an Economist at Citibank from 1979 to 1984. He also analyzed pricing behavior in the metals industry for the Council on Wage and Price Stability in Washington, D.C. In 1999, Mr. Moeller received the award for most accurate forecast from the Forecasters' Club of New York. From 1990 to 1992 he was President of the New York Association for Business Economists. Mr. Moeller earned an M.B.A. in Finance from Fordham University, where he graduated in 1987. He holds a Bachelor of Arts in Economics from George Washington University.
More Economy in Brief


