 Global| Jun 17 2010
U.S. CPI Falls Again While Core Prices Remain Weak
by:Tom Moeller
|in:Economy in Brief
Summary
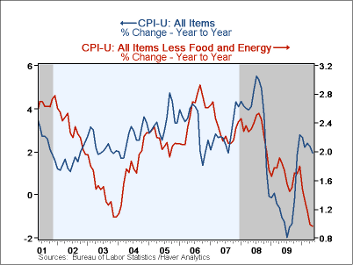
Retail pricing power remained weak month despite some improvement in consumer purchases. The May Consumer Price Index fell 0.2% (+2.0% y/y) for the second consecutive monthly decline. Emphasizing the loss of pricing power, the May CPI [...]
 Retail pricing power remained weak month despite
some improvement in consumer purchases. The May Consumer Price Index
fell 0.2% (+2.0% y/y) for the second consecutive monthly decline.
Emphasizing the loss of pricing power, the May CPI was unchanged from
the December '09 level. The May decline exceeded Consensus expectations
for a 0.1% slip.
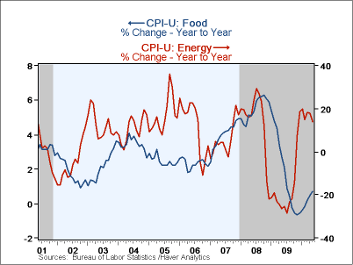
Lower energy prices continued to hold back overall inflation. They fell for the fourth consecutive month led by a 5.2% drop (+27.0% y/y) in gasoline prices. Fuel oil prices fell a lesser 2.0% (NSA, +21.1% y/y) and natural gas & electricity slipped 0.5% (+1.1% y/y).
Food & beverage prices were unchanged after two months of 0.2% increase. For the first five months of 2010 prices have risen at a 1.7% rate, roughly equal to last year's increase. A faster increase in fruit & vegetables (7.9%), meat, poultry & fish (7.1%) and dairy prices (3.7%) led the gain. Finally, the cost of eating out rose at just a 0.8% rate since December, near the record low. Alcoholic beverage prices declined.
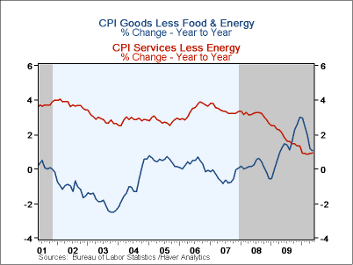
Core consumer prices remained weak. They matched expectations with a 0.1% increase after two months of being unchanged. So far this year core prices have risen at a record low 0.3% annual rate. Core goods prices continued weak, posting a 0.1% uptick following three months of decline. Apparel prices ticked up m/m but remained down 3.8% (AR) so far this year, while prices of home furnishings & operation fell at a 3.5% rate this year. New & used motor vehicles prices ticked 0.2% higher last month and they've risen at a 1.9% this year. Tobacco prices rose 1.3% last month, up at a 4.5% rate in 2010.
Core services prices rose a weakened 0.1% and they're up at a 0.6% rate this year. Weakness stems from shelter prices. They ticked 0.1% higher but they're down at a 1.1% rate this year. Owners equivalent rent of primary residences, a measure not equivalent to other house price measures, was unchanged last month but down at a 0.5% rate this year. Offsetting strength in services prices was provided last month by a 1.5% rise in public transportation costs and they're up at a 4.3% rate this year. Elsewhere in services, education costs rose 0.3% and at a 5.6% rate since December. Medical care services prices were unchanged but up at a 3.7% rate this year.
The chained CPI, which adjusts for shifts in consumption patterns, eased last month and rose 2.0% year-to-year. Chained prices less food & energy gained just 0.6%, a record low.
The consumer price data is available in Haver's USECON database while detailed figures can be found in the CPIDATA database.
Monetary Policy in a Low Inflation Economy with Learning from the Federal Reserve Bank of San Francisco can be found here.
| Consumer Price Index (%) | May | April | March | May y/y | 2009 | 2008 | 2007 |
|---|---|---|---|---|---|---|---|
| Total | -0.2 | -0.1 | 0.1 | 2.0 | -0.3 | 3.8 | 2.9 |
| Total less Food & Energy | 0.1 | 0.0 | 0.0 | 1.0 | 1.7 | 2.3 | 2.3 |
| Goods less Food & Energy | 0.1 | -0.3 | -0.1 | 1.1 | 1.3 | 0.1 | -0.4 |
| Services less Energy | 0.1 | 0.2 | 0.1 | 0.9 | 1.9 | 3.1 | 3.4 |
| Energy | -2.9 | -1.4 | -0.0 | 14.0 | -18.1 | 13.7 | 5.6 |
| Food &Beverages | 0.0 | 0.2 | 0.2 | 0.7 | 1.9 | 5.4 | 3.9 |
| Chained CPI: Total (NSA) | 0.1 | 0.2 | 0.4 | 2.0 | -0.1 | 3.7 | 2.5 |
| Total less Food & Energy | -0.0 | 0.0 | 0.2 | 0.6 | 1.5 | 2.0 | 1.9 |
by Tom Moeller June 17, 2010
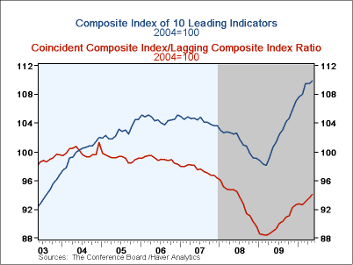
The Conference Board reported that their May Index of Leading Economic Indicators rose 0.4% following an upwardly revised no-change during April. The three-month rate of increase held steady at 7.2% (AR), still its weakest in roughly one year. The leading index is based on actual reports for eight economic data series. The Conference Board initially estimates two series, consumer and capital goods orders.
The breadth of increase amongst the component leading series improved slightly m/m to 50%, still near its lowest since March of last year. A steeper interest rate yield curve, stronger money supply growth and longer hours worked contributed the most positive influences on the May index offset by lower stock prices, lower building permits and lower capital goods orders.
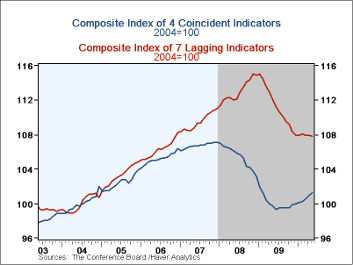
The index of coincident indicators rose 0.4% after an upwardly revised April gain, both the strongest monthly increases since November. The three-month change of 4.5% was its strongest since early-2006. All four of the component series including industrial production, real personal income, business sales and payroll employment contributed positively to last month's increase.
The lagging index slipped 0.1% and has been little-changed since November. The ratio of coincident-to-lagging indicators (another leading indicator) rose slightly to the highest level since July, 2008.
The Conference Board figures are available in Haver's BCI database. Visit the Conference Board's site for coverage of leading indicator series from around the world. The latest U.S. Leading Indicators release can be found here.
| Business Cycle Indicators (%) | May | April | March | Feb. 6-Month % (AR) | 2009 | 2008 | 2007 |
|---|---|---|---|---|---|---|---|
| Leading | 0.4 | 0.0 | 1.4 | 7.9 | 0.5 | -2.7 | -0.2 |
| Coincident | 0.4 | 0.4 | 0.3 | 2.8 | -5.1 | -1.2 | 1.4 |
| Lagging | -0.1 | 0.0 | -0.2 | -0.9 | -1.6 | 3.2 | 3.0 |
 Following three weeks of ease, the rise in
initial unemployment insurance claims last week disappointed Consensus
expectations for another decline. The Bureau of Labor Statistics
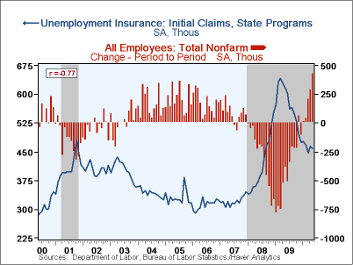
reported that initial claims for jobless insurance rose 12,000 to
472,000 following a 1,000 uptick during the prior week. The latest
level was the highest in four weeks and Consensus expectations were for
450,000 claims. Nevertheless, last week's figure was down from the
recession peak of 651,000 reached in March of 2009. The four-week
moving average of initial claims was roughly unchanged at 463,500.
Claims during the latest week cover the survey period for June nonfarm payrolls. They slipped 2,000 (-0.4%) from the May period. During the last ten years there has been an inverse 77% correlation between the level of claims and the m/m change in nonfarm payrolls.
Continuing claims for unemployment insurance during the latest week rose 88,000 and recovered a third of the prior week's decline. Nevertheless, claims remained near the lowest since December of 2008. Claims were down by one-third from the June '09 peak. The overall decline is a function of the improved job market but also reflects the exhaustion of 26 weeks of unemployment benefits. Continuing claims provide an indication of workers' ability to find employment. The four-week average of continuing claims at 4.601M reached a new cycle low. This series dates back to 1966.
Ongoing claims do not reflect those who receive extended benefits. Extended benefits for unemployment insurance rose sharply in the latest week to 416,513 and it was the highest level since November. These figures do not include the 4,804,030 benefit recipients under state administered "EUC" emergency programs, but paid for by the Federal government.
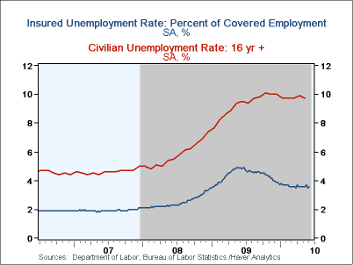
The insured unemployment rate ticked up to 3.6%. It reached a high of 4.9% during May of 2009. During the last ten years, there has been a 96% correlation between the level of the insured unemployment rate and the overall rate of unemployment published by the Bureau of Labor Statistics.
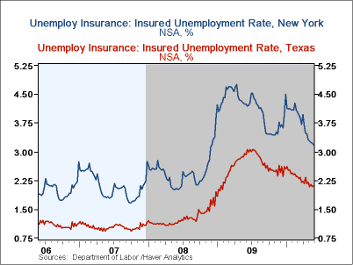
The highest insured unemployment rates in the week ending week ending May 29 were in Puerto Rico (6.2%), Alaska (5.5), Oregon (5.2), Nevada (4.6), Pennsylvania (4.4), North Carolina (4.2), Wisconsin (4.1), California (4.0), Connecticut (4.0), and New Jersey (3.9). The lowest insured unemployment rates were in Virginia (1.8), Texas (2.1), Wyoming (2.4), Tennessee (2.5), Maryland (2.8), Georgia (2.9), Ohio (2.9), Maine (2.8) Florida (3.0) and New York (3.2). These data are not seasonally adjusted but the overall insured unemployment rate is.
The unemployment insurance claims data is available in Haver's WEEKLY database and the state data is in the REGIONW database
| Unemployment Insurance (000s) | 06/12/10 | 06/05/10 | 05/29/10 | Y/Y | 2009 | 2008 | 2007 |
|---|---|---|---|---|---|---|---|
| Initial Claims | 472 | 460 | 459 | -21.9% | 572 | 419 | 321 |
| Continuing Claims | -- | 4,571 | 4,483 | -29.6 | 5,809 | 3,340 | 2,549 |
| Insured Unemployment Rate (%) | 3.6 | 3.5 | 4.9(6/2009) | 4.4 | 2.5 | 1.9 |
by Robert Brusca June 17, 2010
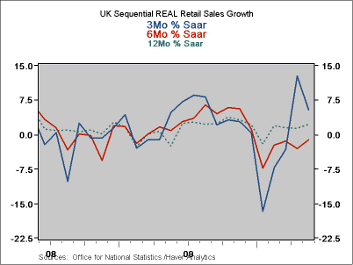 UK retail sales rose by 0.4% in May as April sales were revised lower.
The volume of ex-auto retail sales rose 0.6% from a month earlier and
gained 2.2% on a year-to-year basis in May. The year-to-year increase
was the strongest since November 2009. Economists had expected a 0.3%
monthly gain and a 2.1% year-to-year increase. Both figures were
exceeded but not without some offset.
April, sales were revised down sharply to show an unchanged reading on the month and a 1.3% increase on the year. That revision obviously undercut the May Year-to-Year result as well- which lacking the revision - would have been much stronger. The UK's statistical bureau, the ONS, originally reported that retail sales rose 0.3% on the month and by 1.8% year-to-year.
Still, May's report leaves UK retail sales with some life and with some near term acceleration. World Cup soccer spending is being credited for some of the bump up. The best news is from the impact on spending in the quarter-to-date where real spending is up at a 7.7% annual rate excluding autos.
2-date
by Carol Stone June 17, 2010
 The
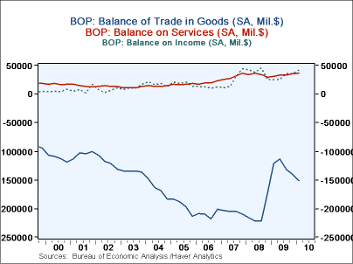
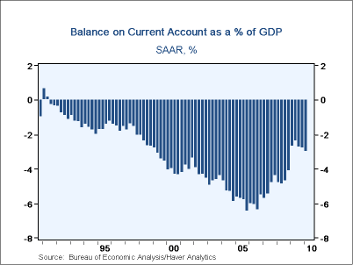
U.S. current account deficit widened in Q1 to $109.0 billion from a
revised $100.9 billion in Q4 2009. The year 2009 was revised
from $419.9 billion to $378.4 billion. Relative to GDP, the
Q1 number is 3.0%, the widest gap since much bigger numbers prevailing
through Q4 2008. Consensus forecasts had called for $121.9 billion in
Q1. Taking account of annual revisions, the actual widening
in the period from the quarter before was larger, $8.1 billion, than
the $3.5 billion in the forecasts. These revisions also
included some changes in coverage, which we describe below where
applicable.
The balance on goods was $151.3 billion in Q1, larger than the $140.1 billion in Q4. Exports of goods gained 5.2%, a third consecutive quarterly increase, putting that total up 19.8% from a year ago. Imports grew 6.1% in the quarter and were up 21.5% from a year ago. The coverage of "goods" has been altered by the annual revisions. It now includes the military goods that had previously been part of services. This change added $3.7 billion to goods in Q4 and $23.0 billion for all of 2009, subtracting commensurately from services. In addition, fuel purchased in domestic and foreign ports by foreign and domestic aircraft and shippers, respectively, has been added to goods; it was previously also included in services. This is a nontrivial shift; purchases by U.S. carriers in foreign terminals added $4.0 billion to goods imports in Q4 and $13.1 billion for 2009. All of these changes begin with 1999 data; the Bureau of Economic Analysis indicated that as of today, it does not expect to carry these changes farther back in history.
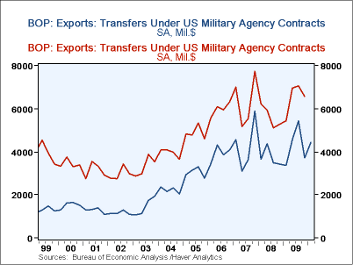
The balance on services was lowered modestly by the coverage revisions just described. It remained fairly near its old values, compared to both the pre-revision levels and the historical trend. Q1 was a surplus of $36.0 billion, following $35.4 billion in Q4; this earlier period was previously reported at $36.5 billion. Exports of services rose 2.6% in the latest quarter and they were 4.6% ahead of the year-earlier period. Travel and passenger fares both showed notable gains. The item "Transfers under U.S. military agency sales contracts" was cut in Q4 from $6.6 billion reported previously to $3.7 billion under the new definition, which now includes only actual services on military aircraft and other equipment under foreign ownership. These service exports rose to $4.4 billion in Q1. Among imports, "other transportation", which now consists mainly in freight charges paid to foreign carriers, increased somewhat, recovering so far about one-third of its recessionary drop.
The balance on income was also subject to sizable revisions, but these apparently resulted only from updated benchmarking to the U.S. Treasury's broadest investment surveys. Investment income receipts and payments were both revised higher, indicating larger inter-national investment holdings than understood before. The net result is an increase in the balance on income from $25.1 billion initially reported for Q4 to $35.1 billion in today's report. Q1 showed a further increase to $41.7 billion. For 2009 as a whole, net income was $121.4 billion, considerably more than the previously reported $89.0 billion. Finally, unilateral transfers showed a net outflow of $35.5 billion in Q1, up from $31.6 billion in Q4 and very little revised from before. Generally the trend in these transfers was reduced somewhat in the revised history, with 2009 showing outflows of $124.5 billion, compared with $130.2 billion in the old data. Government grants increased markedly in the latest period, while private remittances nudged up only marginally.
Commentary on accompanying capital flow data will follow in a subsequent item.
These Balance of Payments data all appear in Haver's USINT database, with summaries available in USECON.
| US Balance of Payments SA | 1Q '10 | 4Q '09 | 3Q '09 | YearAgo | 2009 | 2008 | 2007 |
|---|---|---|---|---|---|---|---|
| Current Account Balance ($ Bil.) | -109.0 | -100.9 | -97.5 | -95.6 | -378.4 | -668.9 | -718.1 |
| Deficit % of GDP | 3.0% | 2.8% | 2.7% | 2.7% | 2.7% | 4.6% | 5.1% |
| Balance on Goods ($ Bil.) | -151.3 | -140.1 | -132.1 | -121.2 | -506.9 | -834.7 | -823.2 |
| Exports | 5.2% | 8.1% | 5.8% | 19.8% | -18.1% | 12.5% | 12.0% |
| Imports | 6.1% | 7.4% | 9.1% | 21.5% | -26.4% | 7.9% | 5.8% |
| Balance on Services ($ Bil.) | 36.0 | 35.4 | 32.8 | 30.8 | 132.0 | 135.8 | 121.1 |
| Exports | 2.3% | 3.7% | 1.2% | 7.8% | -6.0% | 9.4% | 17.1% |
| Imports | 2.6% | 2.1% | 1.9% | 4.6% | -7.0% | 8.5% | 9.1% |
| Balance on Income ($ Bil.) | 41.7 | 35.1 | 35.5 | 24.6 | 121.4 | 152.0 | 99.6 |
| Unilateral Transfers ($ Bil.) | -35.5 | -31.6 | -33.6 | -29.7 | -124.5 | -122.0 | -115.6 |
Tom Moeller
AuthorMore in Author Profile »Prior to joining Haver Analytics in 2000, Mr. Moeller worked as the Economist at Chancellor Capital Management from 1985 to 1999. There, he developed comprehensive economic forecasts and interpreted economic data for equity and fixed income portfolio managers. Also at Chancellor, Mr. Moeller worked as an equity analyst and was responsible for researching and rating companies in the economically sensitive automobile and housing industries for investment in Chancellor’s equity portfolio. Prior to joining Chancellor, Mr. Moeller was an Economist at Citibank from 1979 to 1984. He also analyzed pricing behavior in the metals industry for the Council on Wage and Price Stability in Washington, D.C. In 1999, Mr. Moeller received the award for most accurate forecast from the Forecasters' Club of New York. From 1990 to 1992 he was President of the New York Association for Business Economists. Mr. Moeller earned an M.B.A. in Finance from Fordham University, where he graduated in 1987. He holds a Bachelor of Arts in Economics from George Washington University.
More Economy in Brief
 Global| Feb 05 2026
Charts of the Week: Balanced Policy, Resilient Data and AI Narratives
by:Andrew Cates


