 Global| Aug 18 2006
U.S. Consumer Sentiment Sagged
by:Tom Moeller
|in:Economy in Brief
Summary
Consumer sentiment in early August dropped sharply to the lowest level since last October, according to the University of Michigan. The 7.1% m/m decline in the sentiment index to 78.7 compared to consensus expectations for stability [...]
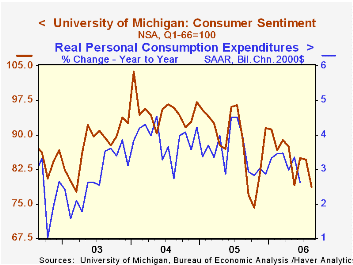
Consumer sentiment in early August dropped sharply to the lowest level since last October, according to the University of Michigan. The 7.1% m/m decline in the sentiment index to 78.7 compared to consensus expectations for stability at 84.0.
During the last ten years there has been a 76% correlation between the level of consumer sentiment and the y/y change in real consumer spending and during those ten years sentiment has a 68% correlation with the change in nonfarm payrolls.
Expectations for the economy posted a notable 11.0% m/m drop to the lowest level last October. The decline was led by a sharp decline in expected 12 month business conditions to the lowest level since September and a more moderate drop in expected conditions during the next five years. The expected change in personal finances also fell sharply to the lowest level since May. 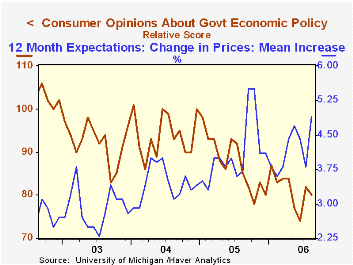
The reading of current economic conditions fell moderately for the second straight month. Details indicate that the index of current personal finances dropped to the lowest level since May but perceived buying conditions for large household goods slipped just modestly m/m (-4.3% y/y).
Consumers' opinion about gov't economic policy slipped a modest 2.4% m/m (-5.9% y/y) after sharp improvement during July. Expected inflation during the next year surged m/m to 4.9%, its highest level in nearly a year. The five to ten year expected rate of inflation also rose to 3.5%, its highest since May.
The University of Michigan survey is not seasonally adjusted.The mid-month survey is based on telephone interviews with 250 households nationwide on personal finances and business and buying conditions. The survey is expanded to a total of 500 interviews at month end.
| University of Michigan | August (Prelim) | July | Y/Y | 2005 | 2004 | 2003 |
|---|---|---|---|---|---|---|
| Consumer Sentiment | 78.7 | 84.7 | -11.7% | 88.6 | 95.2 | 87.6 |
| Current Conditions | 100.8 | 103.5 | -6.8% | 105.9 | 105.6 | 97.2 |
| Expectations | 64.5 | 72.5 | -16.1% | 77.4 | 88.5 | 81.4 |
by Tom Moeller August 18, 2006
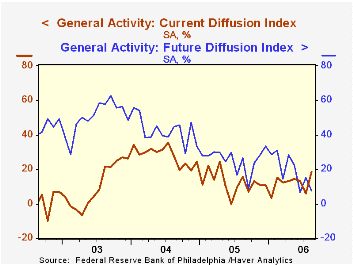
For August, the Philadelphia Federal Reserve Bank's Index of General Business Conditions in the manufacturing sector improved to 18.5 from an unrevised 6.0 during July. The rebound by far outpaced Consensus expectations for an uptick to 8.0 and was to the highest level since April of last year.
During the last ten years there has been a 65% correlation between the level of the Philadelphia Fed Business Conditions Index and three month growth in factory sector industrial production. There has been a 49% correlation with q/q growth in real GDP.
A higher level of shipments drove much of the improvement as the index rose twelve points to 22.3, its highest since March. The new orders sub-index also recovered most of the prior month's sharp decline. Moving in the other direction, the employment index reversed most of its July rebound but still indicated positive growth in factory payrolls. During the last ten years there has been a 75% correlation between the employment index and the three month growth in factory payrolls.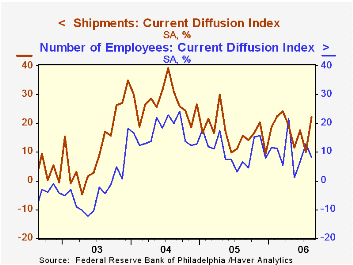
The business conditions index reflects a separate survey question, not the sub indexes.
The prices paid index fell sharply to the lowest level since April. During the last ten years there has been a 76% correlation between the prices paid index and the three month growth in the intermediate goods PPI. There has been an 85% correlation with the change in core intermediate goods prices.
The separate index of expected business conditions in six months reversed about all of its July improvement and during the third quarter the average monthly level (11.4) is down sharply from 2Q (19.2). Notably, expectations for orders and employment were either stable or improved during 3Q versus the 2Q average.
The latest Business Outlook survey from the Philadelphia Federal Reserve Bank can be found here.
| Philadelphia Fed Business Outlook | Aug | July | Aug '05 | 2005 | 2004 | 2003 |
|---|---|---|---|---|---|---|
| General Activity Index | 18.5 | 6.0 | 15.5 | 12.4 | 28.0 | 10.5 |
| Prices Paid Index | 45.3 | 50.3 | 26.9 | 43.5 | 51.2 | 16.8 |
by Carol Stone August 18, 2006
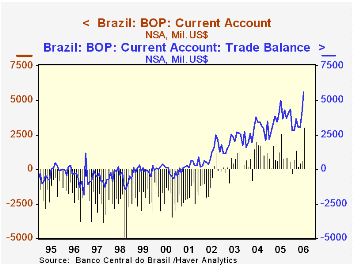
A surge in merchandise exports pushed Brazil's current account to a record surplus in July, $3043 million, as reported late August 17 by the Central Bank of Brazil. With seasonal adjustment by Haver Analytics, the balance is $2203 million, as seen in the table below, the second largest monthly amount after $2715 million in November.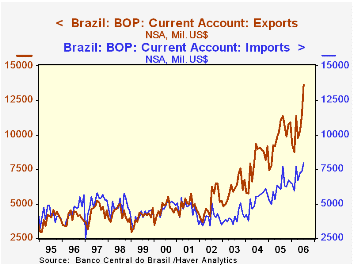
Brazil sells oil, coffee and copper, among numerous other items. Obviously, two of these items have seen major price increases that have raised the value of Brazil's exports. They are up more than 23% from a year ago. This good gain, $2.6 billion, has more than offset a larger percentage increase in imports, nearly 32% on the year, or $1.9 billion.
Frequently, economists and other analysts assess a nation's trade and current account conditions over against the capital and financial accounts. But for Brazil, the more relevant comparison involves the trade balance versus the service and income flows. It is the large trade surplus that "finances" a modest deficit in services and a more significant deficit in income. Brazil has a sizable negative international investment position, -$340 billion at the end of last year, and it sends out considerable amounts of profits, dividends and interest payments. As noted below, the deficit on income exceeds $2.1 billion in most months.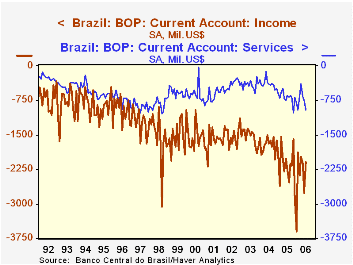
Flows on the financial side are very erratic, but generally direct investment remains positive. So there are consistent flows of foreign equity funds into Brazil, suggesting that companies want increasingly to be represented in that sizable market. Portfolio and "other" investments swing widely from month to month, making it hard to characterize other investors' attitudes toward the country.
| Brazil Mil. US$, Seas Adj. |
July 2006 | June 2006 | May 2006 | July 2005 | Monthly Averages*|||
|---|---|---|---|---|---|---|---|
| 2005 | 2004 | 2003 | |||||
| Current Account | 2203 | 578 | 524 | 1851 | 1183 | 973 | 348 |
| Trade Balance | 4945 | 3714 | 2908 | 4454 | 3729 | 2803 | 2066 |
| Exports | 12651 | 11007 | 10058 | 10304 | 9859 | 8040 | 6090 |
| Imports | 7705 | 7292 | 7150 | 5850 | 6130 | 5236 | 4020 |
| Services | -952 | -747 | -663 | -632 | -679 | -390 | -411 |
| Income | -2102 | -2764 | -2113 | -2253 | -2164 | -1710 | -1546 |

Tom Moeller
AuthorMore in Author Profile »Prior to joining Haver Analytics in 2000, Mr. Moeller worked as the Economist at Chancellor Capital Management from 1985 to 1999. There, he developed comprehensive economic forecasts and interpreted economic data for equity and fixed income portfolio managers. Also at Chancellor, Mr. Moeller worked as an equity analyst and was responsible for researching and rating companies in the economically sensitive automobile and housing industries for investment in Chancellor’s equity portfolio. Prior to joining Chancellor, Mr. Moeller was an Economist at Citibank from 1979 to 1984. He also analyzed pricing behavior in the metals industry for the Council on Wage and Price Stability in Washington, D.C. In 1999, Mr. Moeller received the award for most accurate forecast from the Forecasters' Club of New York. From 1990 to 1992 he was President of the New York Association for Business Economists. Mr. Moeller earned an M.B.A. in Finance from Fordham University, where he graduated in 1987. He holds a Bachelor of Arts in Economics from George Washington University.
More Economy in Brief


