 Global| Mar 03 2006
U.S. Consumer Sentiment Fell Throughout February
by:Tom Moeller
|in:Economy in Brief
Summary
According to the University of Michigan, consumer sentiment fell throughout February, as indicated by a decline in the final month reading to 86.7 from the preliminary estimate of 87.4. Month to month, sentiment fell 4.9% and the [...]
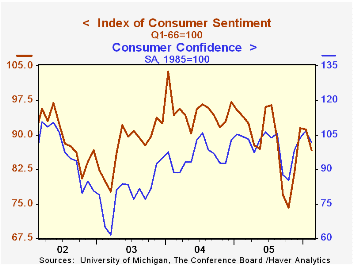
According to the University of Michigan, consumer sentiment fell throughout February, as indicated by a decline in the final month reading to 86.7 from the preliminary estimate of 87.4. Month to month, sentiment fell 4.9% and the decline outpaced Consensus expectations for decline to 87.5.
The m/m decline matched the Conference Board's report Tuesday that Consumer Confidence fell 4.8% (-2.6% y/y) during February.
Sentiment figures are not seasonally adjusted and during the last ten years there has been a 76% correlation between the level of consumer sentiment and the y/y change in real consumer spending.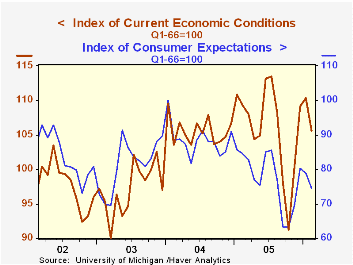
The current conditions index deteriorated 1.9% late in February and fell 4.3% for the full period as the index of personal finances fell 5.1% (-7.4% y/y) and the reading of buying conditions for large household goods fell 3.6% (0.0% y/y). Consumers' assessment of gov't economic policy drooped 4.6% m/m (-10.8% y/y).
Consumer expectations held steady late in the month but for all of February were off 5.6% from January. The economic outlook deteriorated sharply with the index of expected business conditions during the next five years down 12.1% (-18.4% y/y) and the twelve month outlook off 8.6% (-15.8% y/y). Expectations for personal finances showed a m/m improvement of 1.7% (-3.9% y/y).
The mean expected inflation rate for the next twelve months was about stable m/m at 3.7%, still well below the 5.5% expected in October & September.
The University of Michigan survey is not seasonally adjusted.The mid-month survey is based on telephone interviews with 250 households nationwide on personal finances and business and buying conditions. The survey is expanded to a total of 500 interviews at month end.
Income Taxes: Who Pays and How Much? from the Federal Reserve Bank of St. Louis is available here.
| University of Michigan | Feb (Final) | Feb (Prelim.) | Jan | Y/Y | 2005 | 2004 | 2003 |
|---|---|---|---|---|---|---|---|
| Consumer Sentiment | 86.7 | 87.4 | 91.2 | -7.9% | 88.6 | 95.2 | 87.6 |
| Current Conditions | 105.6 | 107.7 | 110.3 | -3.3% | 105.9 | 105.6 | 97.2 |
| Expectations | 74.5 | 74.4 | 78.9 | -11.7% | 77.4 | 88.5 | 81.4 |

Tom Moeller
AuthorMore in Author Profile »Prior to joining Haver Analytics in 2000, Mr. Moeller worked as the Economist at Chancellor Capital Management from 1985 to 1999. There, he developed comprehensive economic forecasts and interpreted economic data for equity and fixed income portfolio managers. Also at Chancellor, Mr. Moeller worked as an equity analyst and was responsible for researching and rating companies in the economically sensitive automobile and housing industries for investment in Chancellor’s equity portfolio. Prior to joining Chancellor, Mr. Moeller was an Economist at Citibank from 1979 to 1984. He also analyzed pricing behavior in the metals industry for the Council on Wage and Price Stability in Washington, D.C. In 1999, Mr. Moeller received the award for most accurate forecast from the Forecasters' Club of New York. From 1990 to 1992 he was President of the New York Association for Business Economists. Mr. Moeller earned an M.B.A. in Finance from Fordham University, where he graduated in 1987. He holds a Bachelor of Arts in Economics from George Washington University.
More Economy in Brief


