 Global| Mar 03 2006
U.S. Consumer Sentiment Fell Throughout February
by:Tom Moeller
|in:Economy in Brief
Summary
According to the University of Michigan, consumer sentiment fell throughout February, as indicated by a decline in the final month reading to 86.7 from the preliminary estimate of 87.4. Month to month, sentiment fell 4.9% and the [...]
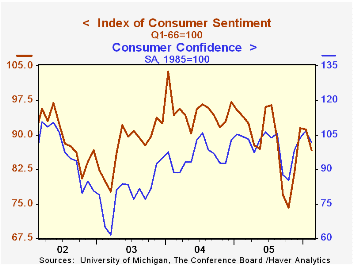
According to the University of Michigan, consumer sentiment fell throughout February, as indicated by a decline in the final month reading to 86.7 from the preliminary estimate of 87.4. Month to month, sentiment fell 4.9% and the decline outpaced Consensus expectations for decline to 87.5.
The m/m decline matched the Conference Board's report Tuesday that Consumer Confidence fell 4.8% (-2.6% y/y) during February.
Sentiment figures are not seasonally adjusted and during the last ten years there has been a 76% correlation between the level of consumer sentiment and the y/y change in real consumer spending.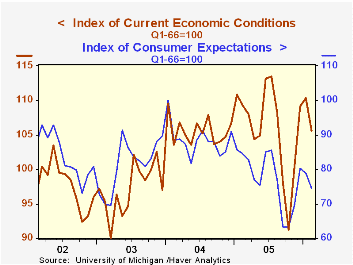
The current conditions index deteriorated 1.9% late in February and fell 4.3% for the full period as the index of personal finances fell 5.1% (-7.4% y/y) and the reading of buying conditions for large household goods fell 3.6% (0.0% y/y). Consumers' assessment of gov't economic policy drooped 4.6% m/m (-10.8% y/y).
Consumer expectations held steady late in the month but for all of February were off 5.6% from January. The economic outlook deteriorated sharply with the index of expected business conditions during the next five years down 12.1% (-18.4% y/y) and the twelve month outlook off 8.6% (-15.8% y/y). Expectations for personal finances showed a m/m improvement of 1.7% (-3.9% y/y).
The mean expected inflation rate for the next twelve months was about stable m/m at 3.7%, still well below the 5.5% expected in October & September.
The University of Michigan survey is not seasonally adjusted.The mid-month survey is based on telephone interviews with 250 households nationwide on personal finances and business and buying conditions. The survey is expanded to a total of 500 interviews at month end.
Income Taxes: Who Pays and How Much? from the Federal Reserve Bank of St. Louis is available here.
| University of Michigan | Feb (Final) | Feb (Prelim.) | Jan | Y/Y | 2005 | 2004 | 2003 |
|---|---|---|---|---|---|---|---|
| Consumer Sentiment | 86.7 | 87.4 | 91.2 | -7.9% | 88.6 | 95.2 | 87.6 |
| Current Conditions | 105.6 | 107.7 | 110.3 | -3.3% | 105.9 | 105.6 | 97.2 |
| Expectations | 74.5 | 74.4 | 78.9 | -11.7% | 77.4 | 88.5 | 81.4 |
by Tom Moeller March 3, 2006
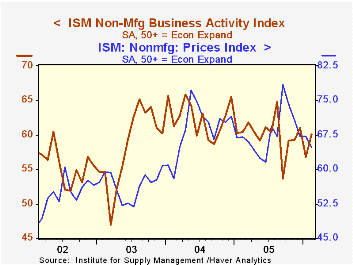
The Institute for Supply Management (ISM) reported that the February Business Activity Index for the non-manufacturing sector recovered most of the prior month's loss with a 3.3 point advance to 60.1. A reading above 50 indicates expansion. The gain outpaced Consensus expectations for a rise to 58.0.
Since the series' inception in 1997 there has been a 53% correlation between the level of the Business Activity Index and the q/q change in real GDP for services plus construction.
The employment index seemed to lead the m/m improvement and rose sharply to 58.2, the highest level since August. Since the series' inception in 1997 there has been a 60% correlation between the level of the ISM non-manufacturing employment index and the m/m change in payroll employment in the service producing plus the construction industries. The new orders index was roughly stable after a sharp decline during January.
Pricing power deteriorated to the weakest level since June. Since inception eight years ago, there has been a 70% correlation between the price index and the y/y change in the GDP Services chain price index.
ISM surveys more than 370 purchasing managers in more than 62 industries including construction, law firms, hospitals, government and retailers. The non-manufacturing survey dates only to July 1997, therefore its seasonal adjustment should be viewed tentatively.Business Activity Index for the non-manufacturing sector reflects a question separate from the subgroups mentioned above. In contrast, the NAPM manufacturing sector composite index is a weighted average five components.
"Measured Pace" in the Conduct of Monetary Policy from the Federal Reserve Bank of St. Louis can be found here.
| ISM Nonmanufacturing Survey | Feb | Jan | Feb '05 | 2005 | 2004 | 2003 |
|---|---|---|---|---|---|---|
| Business Activity Index | 60.1 | 56.8 | 60.4 | 60.1 | 62.5 | 58.3 |
| Prices Index | 64.8 | 67.2 | 67.0 | 67.9 | 68.8 | 56.6 |
by Carol Stone March 3, 2006
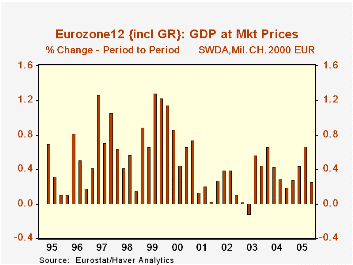
GDP growth in the Euro-Zone slowed in Q4 to 0.3% from 0.7% in Q3, according to the first full breakdown of Q4 data published this morning by Eurostat. These real growth rates are quoted in chained 2000 euros, adopted as the pricing methodology by Eurostat just three months ago.
Several major expenditure components of GDP contributed to the lower growth; most notably, private consumption fell outright by 0.2% and was up a sluggish 0.8% from a year ago. This was among the smallest year-on-year increases in the 10-year history of the data calculated on this basis. However, as we noted here yesterday, retail trade, at least in Germany, turned up sharply in January; perhaps this is a precursor to a better performance for consumer spending in general this quarter.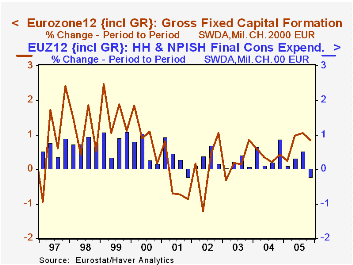
Fixed capital formation moderated to a 0.8% gain in Q4 from 1.1% in Q3. This is still a respectable performance and brought the year to 2.2%, the strongest gain since the tech slowdown began in 2000.
Net exports decreased, encompassing smaller gains in both exports and imports. As with investment, though, the Q4 result followed much stronger outcomes in Q2 and Q3, so can hardly be characterized as "weak" in a broader context. Indeed, observers, including ourselves have noted repeatedly that the export sector is a main support to the European economies at present.
So 2005 ended at a slow pace in Europe. But as mentioned above, retail trade showed some life in Germany already in January, and sentiment surveys have also improved. The Olympics may even give some boost to this quarter's performance. The ECB policymakers must believe gains of that sort will take hold, as they raised their key interest rates yesterday for the second time in three months. M. Trichet's announcement in fact indicated a concern that recently improved economic activity would threaten inflation, which is already hovering above the desired 2% pace.
| EuroZone12: GDP ( Chained 2000 Euros) |
Q3 2005 | Q3 2005 | Q2 2005 | Q4 2004 (yr/yr*) | Yearly Totals*|||
|---|---|---|---|---|---|---|---|
| 2005 | 2004 | 2003 | |||||
| GDP | 0.3 | 0.7 | 0.4 | 1.3 | 1.3 | 2.1 | 0.7 |
| Final Private Consumption | -0.2 | 0.5 | 0.3 | 0.8 | 1.3 | 1.5 | 1.0 |
| Gross Fixed Capital Formation | 0.8 | 1.1 | 1.0 | 2.2 | 2.1 | 2.3 | 0.8 |
| Exports | 0.5 | 3.4 | 2.0 | 4.6 | 3.8 | 6.5 | 1.1 |
| -Imports | 0.9 | 3.1 | 2.3 | 4.5 | 4.5 | 6.6 | 2.9 |

Tom Moeller
AuthorMore in Author Profile »Prior to joining Haver Analytics in 2000, Mr. Moeller worked as the Economist at Chancellor Capital Management from 1985 to 1999. There, he developed comprehensive economic forecasts and interpreted economic data for equity and fixed income portfolio managers. Also at Chancellor, Mr. Moeller worked as an equity analyst and was responsible for researching and rating companies in the economically sensitive automobile and housing industries for investment in Chancellor’s equity portfolio. Prior to joining Chancellor, Mr. Moeller was an Economist at Citibank from 1979 to 1984. He also analyzed pricing behavior in the metals industry for the Council on Wage and Price Stability in Washington, D.C. In 1999, Mr. Moeller received the award for most accurate forecast from the Forecasters' Club of New York. From 1990 to 1992 he was President of the New York Association for Business Economists. Mr. Moeller earned an M.B.A. in Finance from Fordham University, where he graduated in 1987. He holds a Bachelor of Arts in Economics from George Washington University.
More Economy in Brief


