 Global| Apr 08 2010
U.S. Consumer Credit DeclineReverses Earlier Gain
by:Tom Moeller
|in:Economy in Brief
Summary
Consumer borrowing continued its retrenchment during February. Consumer credit outstanding fell $11.5B, reversing a revised $10.6B January increase which was much larger than reported last month. The Federal Reserve reported late- [...]
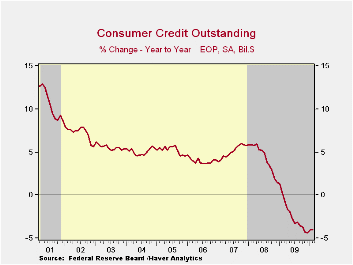
Consumer borrowing continued its retrenchment during February. Consumer credit outstanding fell $11.5B, reversing a revised $10.6B January increase which was much larger than reported last month. The Federal Reserve reported late-Wednesday that the resultant 4.0% y/y decline in credit outstanding remained near the record. During the last ten years, there has been a 60% correlation between the y/y change in credit outstanding and the change in personal consumption expenditures.
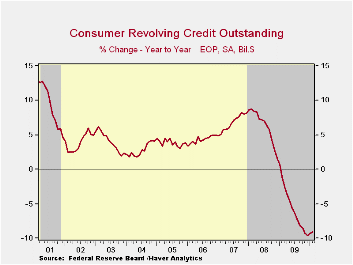
Usage of revolving credit was cut sharply. The $9.5B drop followed a modest January increase and left usage down a near-record 9.1% y/y. Versus February 2009, finance companies lowered lending by 14.3%, commercial bank lending fell 12.7%, pools of securitized assets fell 7.4%. Loans from credit unions offset some of these declines with a 6.5% increase while savings institution raised lending 1.6%.
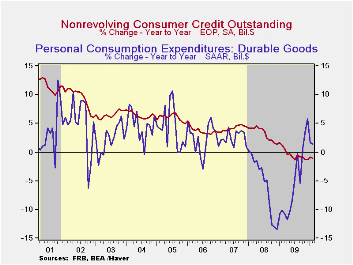
Increased usage of non-revolving credit (autos & other consumer durables), which accounts for nearly two-thirds of the total, fell a moderate $2.0B following a sharp $9.1B January gain. The 1.1% y/y decline is clearly modest relative to the cutback in revolving credit and it has been stable at that rate since the middle of last year. Federal government & Sallie Mae lending expanded by nearly three-quarters y/y during February. That increase offset a 14.5% decline in pools of securitized assets, a 13.7% fall in savings institutions, an 11.8% decline in finance companies, a 2.8% fall in credit union lending and a 0.1% downtick in commercial bank lending.
These figures are the major input to the Fed's quarterly Flow of Funds accounts for the household sector.
| Consumer Credit Outstanding (m/m Chg, SAAR) | February | January | December | Y/Y | 2009 | 2008 | 2007 |
|---|---|---|---|---|---|---|---|
| Total | $-11.5B | $10.6B | $-7.5B | -4.0% | -4.4% | 1.5% | 5.7% |
| Revolving | $-9.5B | $1.5B | $-9.4B | -9.1% | -9.6% | 1.6% | 8.1% |
| Non-revolving | $-2.0B | $9.1B | $1.9B | -1.1% | -1.3% | 1.5% | 4.4% |
by Tom Moeller April 8, 2010
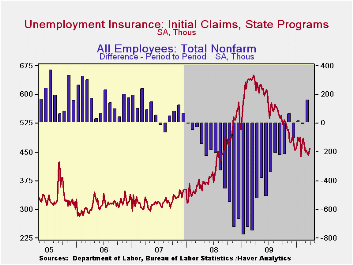
Earlier improvement in the labor market paused last week, according to the Bureau of Labor Statistics. Initial claims for jobless insurance rose 18,000 to 460,000, the highest level in five weeks. The increase followed a 3,000 decline during the prior week which was half that reported initially. Nevertheless, the latest level is down from the recession peak of 651,000 reached in March of 2009. Last week's level exceeded Consensus expectations for 435,000 new claims but the four-week moving average of initial claims rose just slightly to 450,250.
Continuing claims for unemployment insurance during the latest week fell to a new cycle low and are down by one-third since the late-June peak. The overall decline is a function of the improved job market but also reflects the exhaustion of 26 weeks of unemployment benefits. Continuing claims provide an indication of workers' ability to find employment. The four-week average of continuing claims also fell to a cycle low of 4.648 mil. This series dates back to 1966.
Extended benefits for unemployment insurance rose by more-than-one half w/w to 214,393. Nevertheless, they were down by two-thirds from a peak of 597,688 reached in November.Each state administers a separate unemployment insurance program within guidelines established by Federal law. Benefit amounts and the length of time benefits are received are determined by state law. For example, in Michigan and New York, an additional 73 weeks of benefits are available while in California an additional 79 weeks are available.
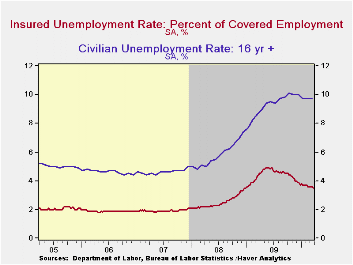
The insured unemployment rate slipped to 3.5% after five weeks at 3.6%. The rate reached a high of 4.9% during May. During the last ten years, there has been a 96% correlation between the level of the insured unemployment rate and the overall rate of unemployment published by the Bureau of Labor Statistics.
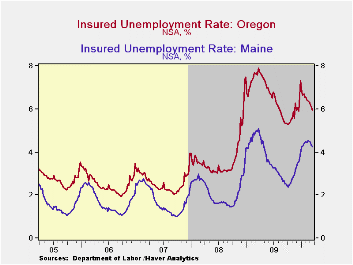
The highest insured unemployment rates in the week ending March 19 were in Alaska (7.1% percent), Oregon (6.0), Wisconsin (5.7), Pennsylvania (5.4), Michigan (5.4), Nevada (5.3), North Carolina (5.0) and Connecticut (5.0). The lowest insured unemployment rates were in Virginia (2.0), Texas (2.3), Georgia (3.0), Florida (3.2), Wyoming (3.4), Maryland (3.4), Ohio (3.5), New York (3.9) and Maine (4.2). These data are not seasonally adjusted but the overall insured unemployment rate is.
The unemployment insurance claims data is available in Haver's WEEKLY database and the state data is in the REGIONW database.
| Unemployment Insurance (000s) | 04/02/10 | 03/26/10 | 03/19/10 | Y/Y | 2009 | 2008 | 2007 |
|---|---|---|---|---|---|---|---|
| Initial Claims | 460 | 442 | 445 | -28.5% | 572 | 419 | 321 |
| Continuing Claims | -- | 4,550 | 4,681 | -22.1% | 5,809 | 3,340 | 2,549 |
| Insured Unemployment Rate (%) | -- | 3.5 | 3.6 | 4.6 (4/2009) | 4.4 | 2.5 | 1.9 |
by Robert Brusca April 8, 2010
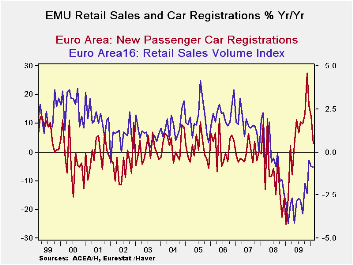
The Euro consumer is not helping to lead growth to the Promised Land. Retail sales came up lame in February after rising by just the thinnest margin of 0.1% in January. The growth rate for retail sales is steady over 3-and 6-months at under 1.5% in nominal terms. The lift from auto sales is going, going gone as purchase incentive plans have ended and the bulge in vehicle registrations is unwinding fast. Retail sales in Germany, the big EMU economy, are off for two months in a row. There is no leadership there.
Greece’s problems continue to worsen and to hang over growth prospects for the Zone. No one is sure just what will happen, but speculation is rife and that makes things worse. The German hard line on Greece that delivers election protection to Angelina Merkel can’t make the Zone look like a very attractive place to be. The cry we heard in the past, ’we are all Europeans now,’ rings hollow. They are all Europeans until a crisis hits then they are German, French, Greek and etc. For now Greek bonds are suffering their widest spreads to bunds since EMU was formed; credit default protection is getting to be very expensive for Greek paper. A few market pundits push for Greece to default but for the most part that is a fringe faction. Most realize the potential dangers from such an event and the risk of knock-on effects from having Greece actually default. Just think of the US and what happened when Lehman Brothers failed. It is often hard to predict the fallout from such events; German banks already hold a lot of Greek bonds on their balance sheets.
Meanwhile the Germans are being tough on Greece. One must wonder if Greece at some point does not simply succumb to the pressure and call the German bluff and let the forces of default begin to run their course, forcing Germany to either to deal with the fallout of default or to back Greece more solidly. In the meantime the Greek tragedy plays out as one of Europe’s longest running sold-out performances. Uncertainty about Greece continues to adversely impact growth in the Zone.
The main bright news for Europe has come from the UK where industrial output has risen strongly (compared to flat output in Germany this month) and rising home prices. The Bank of England is continuing to given the markets there assistance with securities purchases. Still growth in the UK is less than stellar, that’s why the BOE is still providing market support after all.
The US recovery is looking better… then bleaker. While the data clearly have improved, the jobless claims report from the current week has shot up to a five-week high making it clear that jobs growth is mounting no head of steam in the wake of the March jobs report. It’s time to go back to playing fantasy baseball, not fantasy recovery. The Fed Chairman is making it clear that job growth is not significantly in gear, dashing the value of any analysis that was arguing that the Fed is on the brink of a rate hike after one lukewarm job report.
Clearly the global economy is still sputtering. While the US expansion seems to be the strongest that is in train; it continues to be unable to get the various jobs metrics on the right path together with any speed. Consumers remain the key to the global recovery since there are many nations with the ability to supply goods. Germany and China and Japan are exporting again. The US is exporting, too. But exports need consumers, and consumers are holding back, especially in Europe. Investment demand is not enough by itself to drive the kind of recovery that the world needs.
| Euro-Area Retail Sales | ||||||
|---|---|---|---|---|---|---|
| M/M | Saar | |||||
| Feb-10 | Jan-10 | Dec-09 | 3-Mo | 6-MO | 12-Mo | |
| Zone Total Value | 0.0% | 0.1% | 0.2% | 1.4% | 1.3% | -0.5% |
| Food,Bev Tobacco | -0.1% | -0.1% | -0.2% | -1.8% | -2.1% | -2.1% |
| Registrations: | ||||||
| Motor Vehicle Reg | 2.6% | -0.8% | -3.0% | -5.0% | -1.0% | 5.6% |
| NonFood Country detail: Volume | ||||||
| Germany Value | -0.4% | -0.5% | 1.0% | 0.4% | 0.8% | -0.9% |
| UK(EU) Volume | 2.1% | -3.0% | -0.2% | -4.5% | -0.7% | 3.4% |

Tom Moeller
AuthorMore in Author Profile »Prior to joining Haver Analytics in 2000, Mr. Moeller worked as the Economist at Chancellor Capital Management from 1985 to 1999. There, he developed comprehensive economic forecasts and interpreted economic data for equity and fixed income portfolio managers. Also at Chancellor, Mr. Moeller worked as an equity analyst and was responsible for researching and rating companies in the economically sensitive automobile and housing industries for investment in Chancellor’s equity portfolio. Prior to joining Chancellor, Mr. Moeller was an Economist at Citibank from 1979 to 1984. He also analyzed pricing behavior in the metals industry for the Council on Wage and Price Stability in Washington, D.C. In 1999, Mr. Moeller received the award for most accurate forecast from the Forecasters' Club of New York. From 1990 to 1992 he was President of the New York Association for Business Economists. Mr. Moeller earned an M.B.A. in Finance from Fordham University, where he graduated in 1987. He holds a Bachelor of Arts in Economics from George Washington University.
More Economy in Brief


