 Global| Feb 08 2010
U.S. Consumer Credit Becomes ThirdRail Of U.S. Economy
by:Tom Moeller
|in:Economy in Brief
Summary
Consumers steered away from credit last year. In fact, they avoided it to a record degree as the outstanding balance fell by $102.3B, or 4.0%, by yearend from 2008. Released late on Friday, the December decline of $1.8B was the [...]
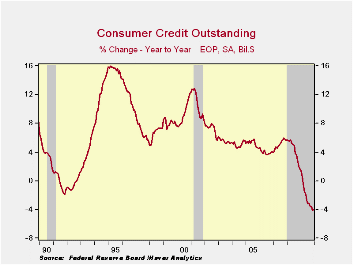 Consumers
steered away from credit last year. In fact, they avoided it
to a record degree as the outstanding balance fell by $102.3B, or 4.0%,
by yearend from 2008. Released late on Friday, the December decline of
$1.8B was the fifteenth monthly drop since summer 2008 though it was
relatively small. Consumer credit outstanding as a percentage of
disposable income fell to 22.0% from its 2005 high of 24.7%.
Nevertheless, these rates remain up from the low near 16% in
1992.
Consumers
steered away from credit last year. In fact, they avoided it
to a record degree as the outstanding balance fell by $102.3B, or 4.0%,
by yearend from 2008. Released late on Friday, the December decline of
$1.8B was the fifteenth monthly drop since summer 2008 though it was
relatively small. Consumer credit outstanding as a percentage of
disposable income fell to 22.0% from its 2005 high of 24.7%.
Nevertheless, these rates remain up from the low near 16% in
1992.
Revolving credit usage fell $8.5B in December and by a
record 9.5% during the year. That was part of a pullback that began
late in 2008. Finance companies lowered lending by more than one third
y/y, commercial bank lending fell a record 14.1%, pools of securitized
assets fell 2.6% and savings institutions pulled back lending by 6.1%
y/y. 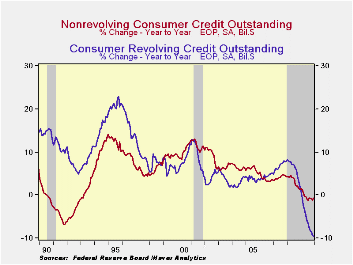 Loans from credit unions offset some of these declines with a 6.3%
increase.
Loans from credit unions offset some of these declines with a 6.3%
increase.
Usage of non-revolving credit (autos & other consumer durables), which accounts for nearly two-thirds of the total, rose $6.8B for December and recouped most of the November decline. Nevertheless, the 0.7% y/y decline was the first since 1992. It reflected a 13.8% shortfall in pools of securitized assets, an 11.7% decline in finance company lending and a 7.2% drop in nonfinancial business credit extensions. These declines were mostly offset by the federal government & Sallie Mae which expanded lending by more than two-thirds y/y.
These figures are the major input to the Fed's quarterly Flow of Funds accounts for the household sector.
Credit data are available in Haver's USECON database. The Flow of Funds data are in Haver's FFUNDS database.
Measuring the equilibrium real interest rate from the Federal Reserve Bank of Chicago is available here.
| Consumer Credit Outstanding (m/m Chg, SAAR) | December | November | October | Y/Y | 2009 | 2008 | 2007 |
|---|---|---|---|---|---|---|---|
| Total | $-1.8 | $-21.8B | $-5.7B | -4.0% | -4.0% | 1.6% | 5.6% |
| Revolving | $-8.5 | $-13.8B | $-6.7B | -9.5% | -9.5 | 1.9% | 7.8% |
| Non-revolving | $6.8 | $-8.0B | $1.1B | -0.7% | -0.7% | 1.4% | 4.4% |
by Robert Brusca February 8, 2010
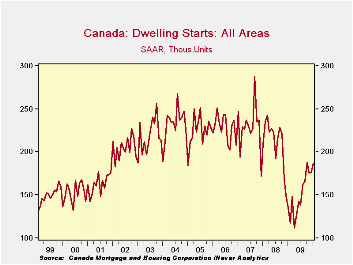 Canada’s
housing starts are in a dig-out phase. The sharp-seeming 5.8% rise this
month only takes starts back toward their recent local peak. Starts are
sharply up from their financial crisis low point but are still well
short of being back at what has passed as normal activity levels in
recent years.
Canada’s
housing starts are in a dig-out phase. The sharp-seeming 5.8% rise this
month only takes starts back toward their recent local peak. Starts are
sharply up from their financial crisis low point but are still well
short of being back at what has passed as normal activity levels in
recent years.
Building permits, which lag housing starts are up on strong growth over the past 3- 6- and 12-months
House price data that are current only through November, show a rise in November. House prices are up over three-months as well as the last six months. Over 12-months prices still are lower by 1.1%.
Canada’s housing market is still obviously struggling to recover. It has moved up strongly from the financial crisis lows. But momentum has become suspect. But suspect momentum is not the same as backsliding. Building permits continue to pile up albeit at a slower pace. Canada’s housing market seems to be suffering the same fate as recovery in many of the worlds leading markets. It has had a vigorous rebound but is flattening out or slowing its paces of increase well short of restoring its former level of activity.
| Canada's Housing Starts | |||
|---|---|---|---|
| Starts | Permit | House Prices | |
| Month-to-Month | |||
| Jan-2010 | 5.8% | -- | -- |
| Dec-2009 | 0.2% | 2.4% | -- |
| Nov-2009 | -6.5% | 11.5% | 0.5% |
| Sequential Growth | |||
| 3-Mo | -0.9% | 17.1% | 2.0% |
| 6-Mo | 34.2% | 42.5% | 2.0% |
| 12-Mo | 37.4% | 33.5% | -1.1% |
| From | Jan-2010 | Dec-2009 | Nov-2009 |
by Louise Curley February 8, 2010
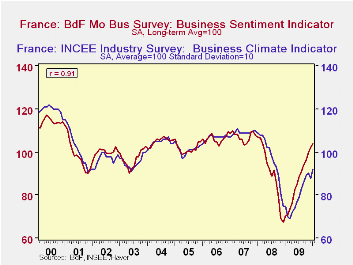
The Bank of France and France's INSEE (Institute National des Statistiques et Etudes Economiques) publish measures of business sentiment in industry. The Bank of France measure canvasses about 6000 managers on various business conditions. The responses are based on the difference between those who view conditions optimistically and those who views them pessimistically. The resulting balances of opinion are expressed in terms of their long term average which is set to 100. Thus the January value of 103.89, released today, indicates that business sentiment is about 4% above its long term average. It has improved, if somewhat erratically, since December 2008 when the indicator was 67.40 or about 33% below the long term average but it is still below 109.69, the peak reached in October 2007, before the current downturn started.
INSEE's measure, which was released last week, is based on the responses of 4000 companies engaged in manufacturing, food processing industries and petroleum refining. It also collects balances of opinion on various business conditions, but expresses the data such that its average is 100 with a standard deviation of 10. The INSEE measure at 92 for January indicates that sentiment is below average--8%--but it has been improving since March 2009 when it was 69 or 31%, or more than three standard deviations, below average.
The two measures are shown in the attached chart. As can be seen, there is a high degree of correlation between the two. Although both show that much of the loss in sentiment suffered during the current downturn has been recovered both show that business sentiment is well below the peaks reached in 2000.
| Business Sentiment in Industry | Jan 10 | Dec 09 | Jan 09 | M/M % Chg | Y/Y % Chg | 2009 | 2008 | 2007 |
|---|---|---|---|---|---|---|---|---|
| Bank of France | 103.89 | 102.19 | 70.47 | 1.66 | 47.42 | 85.89 | 90.62 | 107.18 |
| INSEE | 92 | 88 | 75 | 4.55 | 26.67 | 79 | 97 | 109 |

Tom Moeller
AuthorMore in Author Profile »Prior to joining Haver Analytics in 2000, Mr. Moeller worked as the Economist at Chancellor Capital Management from 1985 to 1999. There, he developed comprehensive economic forecasts and interpreted economic data for equity and fixed income portfolio managers. Also at Chancellor, Mr. Moeller worked as an equity analyst and was responsible for researching and rating companies in the economically sensitive automobile and housing industries for investment in Chancellor’s equity portfolio. Prior to joining Chancellor, Mr. Moeller was an Economist at Citibank from 1979 to 1984. He also analyzed pricing behavior in the metals industry for the Council on Wage and Price Stability in Washington, D.C. In 1999, Mr. Moeller received the award for most accurate forecast from the Forecasters' Club of New York. From 1990 to 1992 he was President of the New York Association for Business Economists. Mr. Moeller earned an M.B.A. in Finance from Fordham University, where he graduated in 1987. He holds a Bachelor of Arts in Economics from George Washington University.
More Economy in Brief


