 Global| Apr 14 2009
U.S. Businesses Inventories Fall Further
by:Tom Moeller
|in:Economy in Brief
Summary
Inventory decumulation remains a dominant trend behind the current economic downturn. Decumulation subtracted 0.3 percentage points from GDP growth last year after a 0.4 percentage point subtraction in 2007, even before the recession [...]
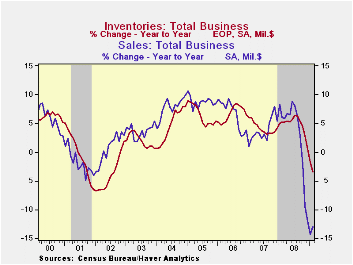
Lower business sales (not to mention the weakness in pricing) continues to propel the inventory correction. Though sales rose 0.2% in February they are down at a 16.2% annual rate over the last three months. The only good news is that the recent rate of decline in sales eased to -16.2% from the peak -40.7% rate this past fall.
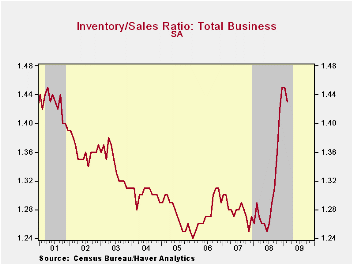
Retailers' inventories fell another sharp 1.2% during February. The three-month rate of decline remained quite strong at 16.3% which was just off the record. The motor vehicle sector has led that decline, shedding inventories at a 32.1% rate over the last three months. Accentuating the downward trend, non-auto retail inventories fell at an 8.6% rate since the fall. Furniture inventories have been dropped at a 15.7% annual rate during the last three months while there's been a 13.5% rate of inventory reduction amongst general merchandise retailers. Rounding out the picture is a 6.2% rate of decline amongst apparel sellers. These cutbacks have been enough to drop the inventory-to-sales ratio amongst retailers to its lowest level since last September.
The inventory cutbacks overall, however, have done little to reduce the I/S ratio for total business. It remained in February near its highest level since 2001 due the wholesale and the factory sectors.
The Peopling of Macroeconomics: Microeconomics of Aggregate Consumer Expenditures from the Federal Reserve Bank of Philadelphia can be found here.
| Business Inventories (%) | February | January | Y/Y | 2008 | 2007 | 2006 |
|---|---|---|---|---|---|---|
| Total | -1.3 | -1.3 | -3.5 | 0.6 | 4.1 | 6.5 |
| Retail | -1.2 | -1.8 | -6.6 | -3.2 | 2.9 | 3.5 |
| Retail excl. Auto | -0.4 | -0.7 | -3.2 | -1.8 | 2.9 | 4.9 |
| Wholesale | -1.5 | -0.9 | -1.7 | 3.1 | 6.2 | 8.2 |
| Manufacturing | -1.2 | -1.1 | -2.0 | 2.1 | 3.7 | 8.2 |

Tom Moeller
AuthorMore in Author Profile »Prior to joining Haver Analytics in 2000, Mr. Moeller worked as the Economist at Chancellor Capital Management from 1985 to 1999. There, he developed comprehensive economic forecasts and interpreted economic data for equity and fixed income portfolio managers. Also at Chancellor, Mr. Moeller worked as an equity analyst and was responsible for researching and rating companies in the economically sensitive automobile and housing industries for investment in Chancellor’s equity portfolio. Prior to joining Chancellor, Mr. Moeller was an Economist at Citibank from 1979 to 1984. He also analyzed pricing behavior in the metals industry for the Council on Wage and Price Stability in Washington, D.C. In 1999, Mr. Moeller received the award for most accurate forecast from the Forecasters' Club of New York. From 1990 to 1992 he was President of the New York Association for Business Economists. Mr. Moeller earned an M.B.A. in Finance from Fordham University, where he graduated in 1987. He holds a Bachelor of Arts in Economics from George Washington University.
More Economy in Brief


