 Global| Apr 13 2009
U.S. Budget Deficit Broaches $1Trillion With TARP Spending
by:Tom Moeller
|in:Economy in Brief
Summary
War in the Mideast, recession at home and TARP lifted the U.S. government's budget deficit to nearly $1 trillion during just the first half of this fiscal year. For all of FY09, the Congressional Budget Office recently estimated that [...]
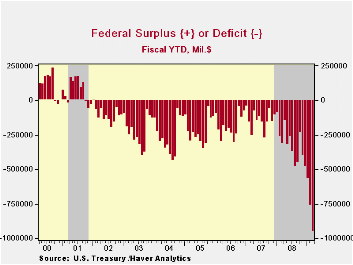
War in the Mideast, recession at home and TARP lifted the U.S. government's budget deficit to nearly $1 trillion during just the first half of this fiscal year. For all of FY09, the Congressional Budget Office recently estimated that the deficit would total $1.2 trillion or 13.1% of GDP. It assumes that revenues will fall 6.6% year-to-year and that outlays will increase 19.0%.
The U.S. government ran a budget deficit of $192.3 billion
during March after a similar February shortfall. Just one year ago, the
March deficit totaled just $48.2 billion and the deficit during the
first six months of FY08 amounted to $312.8 billion, or less than
one-third this year's figure.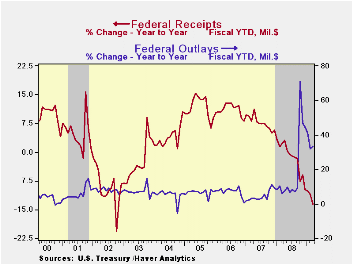
Net revenues during March fell by more than one-quarter versus March of last year and for the first six months of FY09 they were down 13.6% y/y. Year to date, individual income tax receipts fell 14.7% y/y as the recession took its toll and reduced aggregate hours worked. As corporate profits dried up, that lowered corporate tax receipts by more than one-half from last fiscal year. Growth in employment taxes receded to 0.6%, the least since late 2003, and unemployment insurance tax receipts fell 9.7%. Estate & gift taxes fell 10.3% after 11.3% growth last year.
Swelled by TARP, U.S. government outlays jumped by more than 33.0% from last fiscal year's first six months. Outlays under the Government's Troubled Asset Relief Program dropped off sharply during March to $2.9B but for the first six months of the program they totaled $293.4B. The U.S. Treasury adopted the view that these TARP expenditures should be counted like other government spending. In the future when banks repay the Treasury, these funds will be counted as revenue. Accounted for in this way, TARP causes a surge in the budget deficit as the funds are distributed, but leads to a smaller deficit, or perhaps a surplus, when repayments are received.
Defense spending (19% of total outlays) rose 7.7% year-to-year. Medicare expenditures (12% of outlays) increased by 11.2% but the recession swelled "income security" spending (11% of outlays) by roughly one-quarter. Social security payments rose a steady 7.3% while net interest payments continued to fall by more than one-quarter with lower interest rates.
The Government's financial data are available in Haver's USECON database, with extensive detail available in the specialized GOVFIN.
The Middle Income Tax Relief Question: Extend, Modify, or Expire from the American Enterprise Institute can be found here.
| US Government Finance | March | February | Y/Y | FY '09 YTD | FY 2008 | FY 2007 | FY 2006 |
|---|---|---|---|---|---|---|---|
| Budget Balance | -192.3B | $-192.8B | $-48.2B (3/08) |
-$957.0 | -$454.8B | -$161.5B | -$248.2B |
| Net Revenues | $129.0B | $87.3B | -27.9% | -13.6% | -1.7% | 6.7% | 11.8% |
| Net Outlays | $321.2B | $280.1B | 41.5% | 33.4% | 9.1% | 2.8% | 7.4% |
by Robert Brusca April 13, 2009
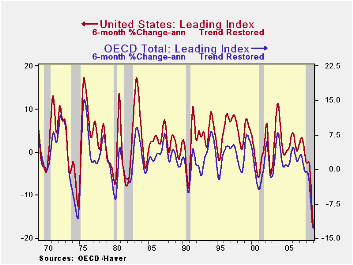
The OECD trend restored leading indicators show that a very
deep recession is underway. The declines in the LEIs over 6-months are
the most severe of the modern post-war period. The LEI declines are
sharper than in either of the two severe global recessions of 1973-75
and 1981-82. The 1973 recession was spawned by a similar common cause:
higher world oil prices and subsequently an oil embargo on the US by
Arab countries. The 1981-82 recession was the result of central banks
finally drawing a line in the sand over inflation. The last two (US)
recessions were not especially severe and except for the grey bars that
identify them as recessions, they might be hard to recognize as such by
the amplitudes of the indices alone. But the current cycle is readily
recognized.
Moreover history shows how the US cycle has dominated the OECD
cycle. Despite a view ahead of this cycle that there would be some
decoupling, especially for the developing (non OECD) world it did not
happen. There is no evidence of decoupling in the US-OECD comparisons
and indeed, developing economies did not decouple at all. China’s and
India’s strong growth cycles and the huge building boom in the Middle
East all were undercut by the severity of this cycle. The flaw in this
logic was that all these regions depended heavily on trade and the US
economy was the engine of growth. Despite having powerful domestic
forces for growth, the rest of the world could not do without the
strength of the US economy. Decoupling was an idea without much basis.
The OECD indices show how much the entire OECD area moves in sync with the US economy. Recovery depends on the US economy too. So far there are some signs of green shoots according to the Fed Chairman and some glimmers of hope according to the President. But there is nothing for certain. The OECD area is still declining aggressively. The ECB could still cuts rates more. European stimulus is still being portioned out. China is now talking about doing more. While Japan looks to be on the brink of more deflation, in the US a core of believers is becoming concerned about eventual inflation.
| OECD Trend-restored leading Indicators | ||||
|---|---|---|---|---|
| Growth progression-SAAR | ||||
| 3Mos | 6Mos | 12mos | Yr-Ago | |
| OECD | -10.4% | -12.3% | -9.1% | 0.1% |
| OECD7 | -13.3% | -14.6% | -10.2% | -0.4% |
| OECD US | -16.4% | -17.6% | -11.7% | -0.4% |
| Six month readings at 6-Mo Intervals: | ||||
| Recent six | 6Mo Ago | 12Mo Ago | 18MO Ago | |
| OECD | -12.3% | -5.7% | -0.6% | 0.9% |
| OECD7 | -14.6% | -5.6% | -1.5% | 0.6% |
| OECD US | -17.6% | -5.5% | -2.6% | 1.9% |
| Slowdowns indicated by BOLD RED | ||||
by Louise Curley April 13, 2009
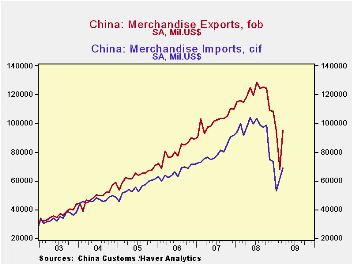 China is one of the earliest
countries to report March trade
data. On a seasonally unadjusted basis exports were up 39.1% in March
after falling for five successive months. Exports are still 17% below
the year ago figure, but that is an improvement over February's showing
of exports 25% below a year ago. Imports have increased in both
February and March, but are still 25% below a year ago. China's exports
and imports are shown in the first chart.
China is one of the earliest
countries to report March trade
data. On a seasonally unadjusted basis exports were up 39.1% in March
after falling for five successive months. Exports are still 17% below
the year ago figure, but that is an improvement over February's showing
of exports 25% below a year ago. Imports have increased in both
February and March, but are still 25% below a year ago. China's exports
and imports are shown in the first chart.
An increase in China's exports usually indicates an
improvement in the economic climate of its customers and an increase in
China's imports usually indicates an improvement in its own economic
climate. However, one month increases in unseasonally adjusted data do
not assure a change in trend. The increase in China's trade is a good
omen for world trade but, once again, one month's change does not mean
a change in the trend.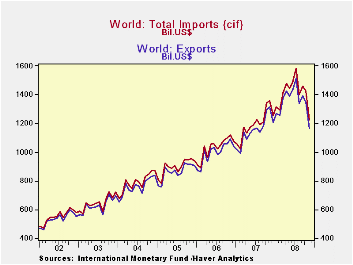
Data on total world exports and imports are compiled by the International Monetary Fund and are available in the monthly Haver Database IMFDOT. Because of the difficulty of collecting the data, they are not very current. The latest data now available are for November 2008. They show sharp drops in both exports and imports for that month, as shown in the second chart. Country data that are more up to date have been showing declines in exports and imports through February 2009.
| CHINA | Mar 09 | Feb 09 | Jan 09 | Dec 08 | Nov 08 | Oct 08 | Sep 08 |
|---|---|---|---|---|---|---|---|
| Exports (Mil USD) | 90291 | 64895 | 90454 | 111157 | 114987 | 128327 | 136411 |
| Imports | 71729 | 60054 | 51344 | 72177 | 74897 | 93088 | 107045 |
| Surplus | 18562 | 4841 | 39110 | 38980 | 40090 | 35239 | 29366 |

Tom Moeller
AuthorMore in Author Profile »Prior to joining Haver Analytics in 2000, Mr. Moeller worked as the Economist at Chancellor Capital Management from 1985 to 1999. There, he developed comprehensive economic forecasts and interpreted economic data for equity and fixed income portfolio managers. Also at Chancellor, Mr. Moeller worked as an equity analyst and was responsible for researching and rating companies in the economically sensitive automobile and housing industries for investment in Chancellor’s equity portfolio. Prior to joining Chancellor, Mr. Moeller was an Economist at Citibank from 1979 to 1984. He also analyzed pricing behavior in the metals industry for the Council on Wage and Price Stability in Washington, D.C. In 1999, Mr. Moeller received the award for most accurate forecast from the Forecasters' Club of New York. From 1990 to 1992 he was President of the New York Association for Business Economists. Mr. Moeller earned an M.B.A. in Finance from Fordham University, where he graduated in 1987. He holds a Bachelor of Arts in Economics from George Washington University.
More Economy in Brief


