 Global| Mar 16 2009
Skid in U.S. Factory Output Is Sharpest Since 1975; Utilization Rate Reaches Record Low
by:Tom Moeller
|in:Economy in Brief
Summary
Declining demand coupled with cutbacks to inventory levels continue to severely depress U.S. factory sector activity. During February, industrial production fell 1.5% after the little-revised 1.9% drop during January. Last month's [...]
Declining demand coupled with cutbacks to inventory levels continue to severely depress U.S. factory sector activity. During February, industrial production fell 1.5% after the little-revised 1.9% drop during January. Last month's decline about matched Consensus expectations for a 1.3% decline.
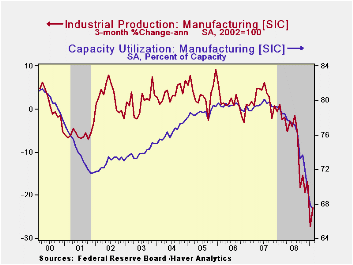
Year-to-year output fell 12.2%, the sharpest decline since early 1975. The drop owes to reduced U.S. demand, inventory cutbacks and recessions abroad. These forces have combined to lower overall U.S. production to a degree that roughly matches earlier, severe recessions. Moreover, the decline is just short of the record set following World War II.
To make matters worse, the falloff has been picking up
momentum. During the last three months, the rate of decline accelerated
to 20.8% (AR). Factory sector output alone is off at a 22.9% annual
rate during the last three months versus a full-year drop of 2.6%.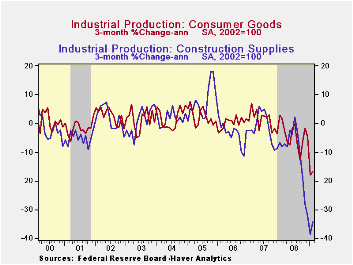
The downward trend in the output of motor vehicles & parts took a breather last month and production rose 10.2%. Nevertheless, output fell at a 66.3% annual rate during the last three months. Outside of the auto sector, output also was hard hit. It fell 1.7% during February and at an 18.0% rate during the last three months. The downturn in the housing market continues to cause stress. Output of construction supplies fell 2.2% last month and at a 34.1% annual rate during the last three. Output of consumer goods overall fell 0.7% last month and at a 17.0% rate since November. Production of furniture fell at a 25.0% rate during the last three months while apparel output fell at a 24.8% rate. Production of business equipment continued lower last month with a 1.3% decline and it fell at an 11.5% since November.
Pain has come to an area which previously was immune. Industrial production in the high-tech sector fell 3.4% last month and at a 32.1% rate during the last three. That follows a 16.0% increase during last year. Less high tech, overall industrial production fell 0.8% during February and the annual rate of change of -24.7% was the weakest since 1975.
Outside of the auto and high tech sectors, total factory production fell 1.1% last month and the three-month annual rate of decline accelerated further to -19.1%.
Excess capacity grew even further last month. Capacity utilization fell to 70.9%, the lowest level since 1982. Utilization in the factory sector dropped even harder to 67.4% from a peak near 80% back in 2007. The latest rate was a record low. Growth in the total productive capacity of the factory sector has slowed to 1.2% (y/y).
The industrial production data are available in Haver's USECON database.
The Credit Crunch of 2007-2008: A Discussion of the Background, Market Reactions and Policy Responses from the Federal Reserve Bank of St. Louis can be found here.
| INDUSTRIAL PRODUCTION (SA, %) | February | January | Y/Y | 2008 | 2007 | 2006 |
|---|---|---|---|---|---|---|
| Total Output | -1.5 | -1.9 | -11.2 | -1.8 | 1.7 | 2.2 |
| Manufacturing | -0.8 | -2.7 | -13.1 | -2.6 | 1.7 | 2.4 |
| Consumer Goods | -0.7 | -2.0 | -8.5 | -2.1 | 1.7 | 0.3 |
| Business Equipment | -1.3 | -4.3 | -11.8 | -1.2 | 3.3 | 10.4 |
| Construction Supplies | -2.2 | -4.1 | -18.2 | -6.2 | -2.5 | 2.2 |
| Utilities | -7.7 | 2.6 | -7.8 | 0.5 | 3.3 | -0.6 |
| Capacity Utilization | 70.9 | 71.9 | 80.7 (Feb.'08) | 78.2 | 81.0 | 80.9 |
by Tom Moeller March 16, 2009
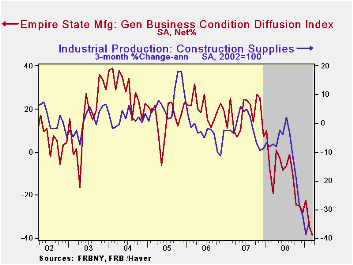
This month's Empire State Index of manufacturing sector activity, reported by the Federal Reserve Bank of New York, fell to a new low for the series which dates back to 2001. Continued stress was indicated by the reading of -38.23, down from -34.65 in February. The index averaged -10.10 last year and +17.23 during 2007. March's level was lower than Consensus expectations for a reading of -32.0.
The figure is a diffusion index. Since the series' inception in 2001 there has been a 68% correlation between its level and the three-month change in U.S. factory sector industrial production.
Price deflation was the message from the index of pricing
pressure which remained negative for the fourth straight month, near
the series' low. Since inception in 2001, there has been a 76%
correlation between the index of prices paid and the three-month change
in the core intermediate materials PPI.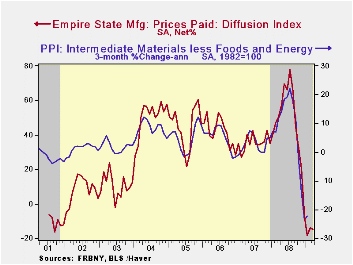
The new orders index fell sharply to a new series low of -44.76. That compares to last March's reading of -44.76. More than fifty percent of survey participants reported lower levels of orders while only nine percent reported a higher reading.
The employment index fell slightly and remained near the series' low. In the history of the NY employment index, there has been an 87% correlation between it and the three-month growth in overall U.S. factory sector employment as reported by the Labor Department.
The Empire State index of expected business conditions in six months improved slightly from near the series' low. The subseries for employment and new orders improved slightly. The pricing index was unchanged after having moved into negative territory.
Like the Philadelphia Fed Index of General Business Conditions, the Empire State Business Conditions Index reflects answers to independent survey questions; it is not a weighted combination of the components.
The Empire State Manufacturing Survey is a monthly survey of manufacturers in New York State conducted by the Federal Reserve Bank of New York. Participants from across the state in a variety of industries respond to a questionnaire and report the change in a variety of indicators from the previous month. Respondents also state the likely direction of these same indicators six months ahead.
For more on the Empire State Manufacturing Survey, including methodologies and the latest report, click here.
The Empire State data is available in Haver's SURVEYS database.
| Empire State Manufacturing Survey | March | February | March1 '08 | 2008 | 2007 | 2006 |
|---|---|---|---|---|---|---|
| General Business Conditions (diffusion index, %) | -38.23 | -34.65 | -19.28 | -10.10 | 17.23 | 20.24 |
| Prices Paid | -14.61 | -13.79 | 50.56 | 46.99 | 35.64 | 41.88 |
by Louise Curley March 16, 2009
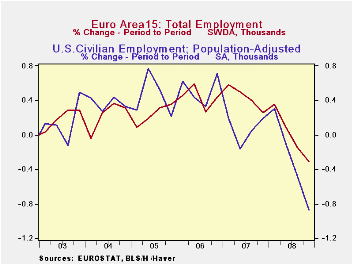 Employment, typically a lagging indicator, declined for the
second quarter in the Euro Area. The decline was 453,000 after a
decline of 215, 000 in the third quarter. In the United States,
comparable figures were declines of 1,261,000 and 700.000. Employment
data are available only on a quarterly basis in the EUROSTAT data base
while monthly data are available for the U.S. in USECON. The first
chart shows the monthly data for the U. S. and the quarterly data for
the Euro Area. Unemployment data, for the Euro Area, however, are
available on a monthly basis.
Employment, typically a lagging indicator, declined for the
second quarter in the Euro Area. The decline was 453,000 after a
decline of 215, 000 in the third quarter. In the United States,
comparable figures were declines of 1,261,000 and 700.000. Employment
data are available only on a quarterly basis in the EUROSTAT data base
while monthly data are available for the U.S. in USECON. The first
chart shows the monthly data for the U. S. and the quarterly data for
the Euro Area. Unemployment data, for the Euro Area, however, are
available on a monthly basis.  As the January unemployment rate for the
Euro Area increased to 8.2% from the fourth quarter average of 7.9%,
employment in the Euro Area in the first quarter of 2009 is likely to
show a decline in employment, but probably of a smaller magnitude that
that shown for the U. S. in January and February.
As the January unemployment rate for the
Euro Area increased to 8.2% from the fourth quarter average of 7.9%,
employment in the Euro Area in the first quarter of 2009 is likely to
show a decline in employment, but probably of a smaller magnitude that
that shown for the U. S. in January and February.
During the three years from 2004 through 2006, employment in
the Euro Area increased at a slower pace than employment in the U. S.
By mid 2007 the two areas had roughly the same employment--
approximately 145 million. Since then both areas began to add fewer
employee. 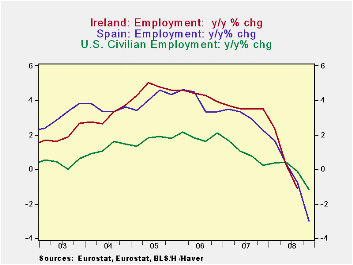 The U. S. added fewer employees than the Euro Area and in the
second quarter of 2008 began to reduce employment. The Euro area began
to reduce employment in the third quarter. By year end employment in
the Euro Area was down 0.02% from year end 2007 compared to a reduction
of 0.08% in the U.S.. The quarterly percentage changes in employment in
the Euro Area and in the U. S. are shown in the second chart.
The U. S. added fewer employees than the Euro Area and in the
second quarter of 2008 began to reduce employment. The Euro area began
to reduce employment in the third quarter. By year end employment in
the Euro Area was down 0.02% from year end 2007 compared to a reduction
of 0.08% in the U.S.. The quarterly percentage changes in employment in
the Euro Area and in the U. S. are shown in the second chart.
| EMPLOYMENT (in Thousands) | Q4 08 | Q3 08 | Q4 07 | Q/Q CHG | Y/Y CHG | 2008 | 2007 |
|---|---|---|---|---|---|---|---|
| United States | 143641 | 144902 | 145320 | 0.08 | -1.15 | 144977 | 145141 |
| Euro Area | 145374 | 145827 | 145400 | -0.02 | -- | 145790 | 144633 |
| Y/Y Percent Change (%) | Q4 08 | Q3 08 | Q2 08 | Q1 08 | Q4 07 | -- | -- |
| Euro Area | -0.01 | 0.58 | 1.10 | 1.49 | 1.46 | -- | -- |
| Ireland | -- | -1.12 | -1.0 | 0.28 | 2.41 | -- | -- |
| Spain | -2.99 | -0.77 | 0.32 | 1.66 | 2.26 | -- | -- |
| United States | -1.15 | -0.10 | 0.43 | 0.38 | 0.26 | -- | -- |
by Robert Brusca March 16, 2009
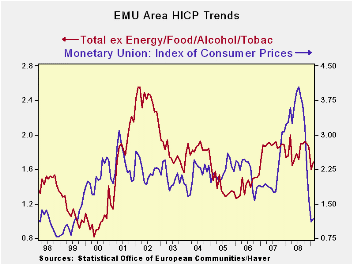
Inflation in the Area rose in February but at 1.2% the Yr/yr pace of inflation remained well in check. Core inflation at 1.7% is confirming that tepid reading. Three-month inflation and service sector inflation ticked up over three-months compared to their respective 6-month pace. Core inflation trends in Germany Italy and Spain seem to be well contained as well, contributing to the notion that inflation in the zone is truly under control. Headline inflation did rise on a broad front in February but the core pace remains solid and low and the annual numbers are quite well behaved. The report should be quite acceptable to the ECB.
| Trends in HICP | |||||||
|---|---|---|---|---|---|---|---|
| % mo/mo | % Saar | ||||||
| Feb-09 | Jan-09 | Dec-08 | 3-Mo | 6-Mo | 12-Mo | Yr Ago | |
| EMU | 0.3% | -0.2% | -0.4% | -0.9% | -1.0% | 1.2% | 3.3% |
| Core | 0.2% | -0.2% | 0.1% | 0.6% | 1.1% | 1.7% | 2.4% |
| Goods | 0.3% | -1.2% | -0.8% | -6.3% | -3.2% | 0.3% | 3.8% |
| Services | 0.5% | -0.4% | 0.8% | 3.9% | 0.6% | 2.4% | 2.5% |
| HICP | |||||||
| Germany | 0.3% | 0.0% | -0.3% | 0.0% | -0.7% | 1.0% | 3.0% |
| France | 0.3% | -0.1% | -0.3% | -0.3% | -1.0% | 1.0% | 3.2% |
| Italy | 0.4% | -0.6% | 0.0% | -0.7% | -0.7% | 1.6% | 3.1% |
| Spain | 0.2% | -0.4% | -0.5% | -2.4% | -2.7% | 0.7% | 4.4% |
| Core: xFE&A | |||||||
| Germany | 0.4% | -0.1% | 0.1% | 1.5% | 0.8% | 1.2% | 2.2% |
| Italy | 0.5% | -0.6% | 0.2% | 0.4% | 1.1% | 2.2% | 2.4% |
| Spain | -0.2% | -0.2% | 0.0% | -1.3% | -0.1% | 1.6% | 3.3% |
by Tom Moeller March 16, 2009
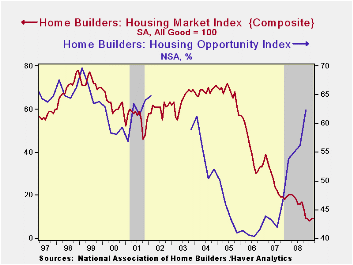
Still under extreme pressure, the March Housing Market Index (HMI) from the National Association of Home Builders remained stable month-to-month at 9. During four of the last five months the index level of 9 was barley above the record low of 8 touched during January. The index is compiled from survey questions asking builders to rate market conditions as “good”, “fair”, “poor” or “very high” to “very low”. Numerical results over 50 indicate a predominance of “good” readings.
The Home Builders Association indicated that its sub-index of present sales remained at a reading of 7, up just slightly from the record low touched during January. The latest figure remained well below last year's average level of 16, 2007's average of 27, 2006's average of 45 and 2005's average of 73.Since 1990, the year-to-year change in this index has had an 80% correlation with the year-to-year percentage change in new single-family home sales.
The index of builders’ expectations for home sales in six
months remained at its record low. In addition, the
“traffic" of prospective buyers fell back and reversed most of the
February uptick. The index remained near the record low.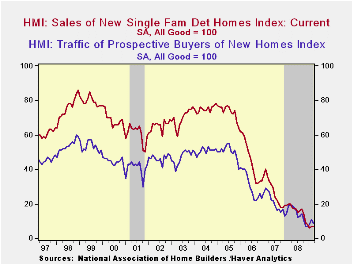
Index readings in each of the country's regions remained near the record low.
Not only are builders disturbed by the market for new homes, but in the fourth quarter the assessment of conditions for remodeling a home reached a record low. The conditions for major and minor alterations fell sharply. Expectations also fell to a record low. Emphasizing that weakness was that the backlog of remodeling jobs fell to one third the peak reached during 2005.
During the fourth quarter the Home Builders' Housing Opportunity Index, which is the share of homes sold that could be considered affordable to a family earning the median income, rose even higher to its highest level since early 2002. It was up by nearly one half from the 2006 low due to lower home prices, lower interest rates and higher income. (There is a break in the series from 2002 to 2003.)
The NAHB has compiled the Housing Market Index since 1985. The weights assigned to the individual index components are .5920 for single family detached sales, present time; .1358 for single family detached sales, next six months; and .2722 for traffic of prospective buyers. The results, along with other housing and remodeling indexes from NAHB Economics, are included in Haver’s SURVEYS database.
Relief for Responsible Homeowners One Step Closer Under New Treasury Guidelines is available here.
| Nat'l Association of Home Builders | March | February | March '08 | 2008 | 2007 | 2006 |
|---|---|---|---|---|---|---|
| Composite Housing Market Index (All Good = 100) | 9 | 9 | 20 | 16 | 27 | 42 |
| Single-Family Sales | 7 | 7 | 20 | 16 | 27 | 45 |
| Single-Family Sales: Next Six Months | 15 | 15 | 26 | 25 | 37 | 51 |
| Traffic of Prospective Buyers | 9 | 11 | 19 | 14 | 21 | 30 |

Tom Moeller
AuthorMore in Author Profile »Prior to joining Haver Analytics in 2000, Mr. Moeller worked as the Economist at Chancellor Capital Management from 1985 to 1999. There, he developed comprehensive economic forecasts and interpreted economic data for equity and fixed income portfolio managers. Also at Chancellor, Mr. Moeller worked as an equity analyst and was responsible for researching and rating companies in the economically sensitive automobile and housing industries for investment in Chancellor’s equity portfolio. Prior to joining Chancellor, Mr. Moeller was an Economist at Citibank from 1979 to 1984. He also analyzed pricing behavior in the metals industry for the Council on Wage and Price Stability in Washington, D.C. In 1999, Mr. Moeller received the award for most accurate forecast from the Forecasters' Club of New York. From 1990 to 1992 he was President of the New York Association for Business Economists. Mr. Moeller earned an M.B.A. in Finance from Fordham University, where he graduated in 1987. He holds a Bachelor of Arts in Economics from George Washington University.
More Economy in Brief


