 Global| Aug 31 2009
Several Indices of MidwestEconomic Activity Improve; August PMI Moves To Break-Even
by:Tom Moeller
|in:Economy in Brief
Summary
Middle America finally appears to be emerging from its sharp recession. Reporting this morning, the Chicago Purchasing Managers Association indicated that its August Business Barometer Index rose to 50, at the break-even level for the [...]
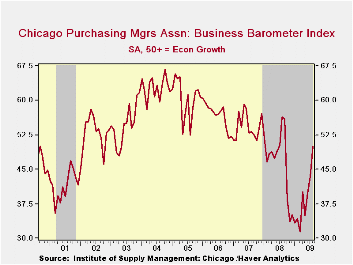 Middle
America finally appears to be emerging from its sharp recession.
Reporting this morning, the Chicago Purchasing Managers Association
indicated that its August Business Barometer Index rose to 50, at the
break-even level for the first month since last September. The increase
was led by a rise in the orders and production components that breached
50 for the first month since June of last year. In addition, the order
backlogs index surged to its highest level since last September. The
employment series also gained but only back to its December level. The
Chicago PMI figures are diffusion indexes and are available in Haver's SURVEYS
database.
Middle
America finally appears to be emerging from its sharp recession.
Reporting this morning, the Chicago Purchasing Managers Association
indicated that its August Business Barometer Index rose to 50, at the
break-even level for the first month since last September. The increase
was led by a rise in the orders and production components that breached
50 for the first month since June of last year. In addition, the order
backlogs index surged to its highest level since last September. The
employment series also gained but only back to its December level. The
Chicago PMI figures are diffusion indexes and are available in Haver's SURVEYS
database.
In a separate report issued last week, the Chicago
Federal Reserve Bank reported that the National Activity Index (CFNAI)
rose in July to the highest level since January of last year. The
reading of -0.74 was up from June and both figures were higher than the
series' low of -3.99 reached this past January. Since 1970 there has
been a 74% correlation between the level of the index and the q/q
change in real GDP. 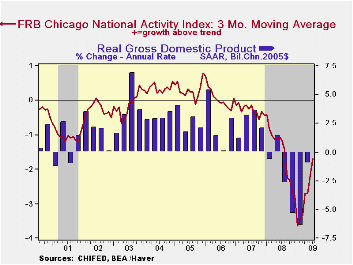 The three-month moving average
of the index also improved to its highest level since August. An index
level at or below -0.70 typically has indicated negative U.S. economic
growth. A zero value of the CFNAI indicates that the economy is
expanding at its historical trend rate of growth of roughly 3%. The
complete CFNAI report is available here.·
The production and income components made the largest positive
contributions to the July CFNAI. Thirty-five of the index components
had a positive influence on the overall index while 50 had a negative
influence.
The three-month moving average
of the index also improved to its highest level since August. An index
level at or below -0.70 typically has indicated negative U.S. economic
growth. A zero value of the CFNAI indicates that the economy is
expanding at its historical trend rate of growth of roughly 3%. The
complete CFNAI report is available here.·
The production and income components made the largest positive
contributions to the July CFNAI. Thirty-five of the index components
had a positive influence on the overall index while 50 had a negative
influence. 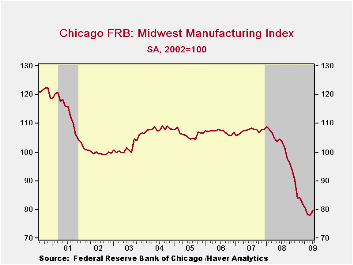 These figures contrast to last month's report on June
activity when 22 of the index components had a positive influence while
63 made a negative contribution. The CFNAI is a weighted average of 85
indicators of economic activity. The indicators reflect activity in the
following categories: production & income, the labor market,
personal consumption & housing, manufacturing & trade
sales, and inventories & orders.
These figures contrast to last month's report on June
activity when 22 of the index components had a positive influence while
63 made a negative contribution. The CFNAI is a weighted average of 85
indicators of economic activity. The indicators reflect activity in the
following categories: production & income, the labor market,
personal consumption & housing, manufacturing & trade
sales, and inventories & orders.
In yet a third survey, the Chicago Fed indicated that its Midwest manufacturing index improved slightly during July and recovered declines during the prior two months. Nevertheless, the figure remained near the lowest since 2003. Indicators for the auto and steel sectors rose while machinery fell. The Chicago Federal Reserve figures also are available in Haver's SURVEYS database.
Clearing and settlement of exchange traded derivatives from the Federal Reserve Bank of Chicago can be found here.
| August | July | June | Aug. '08 | 2008 | 2007 | 2006 | |
|---|---|---|---|---|---|---|---|
| Chicago Purchasing Managers Index | 50.0 | 43.4 | 39.9 | 56.4 | 46.8 | 54.4 | 56.8 |
| New Orders | 52.5 | 48.0 | 41.6 | 58.0 | 46.7 | 57.7 | 59.9 |
| Production | 52.9 | 43.3 | 39.3 | 61.2 | 48.1 | 58.3 | 60.3 |
| Employment | 38.7 | 35.3 | 28.9 | 39.2 | 41.4 | 51.5 | 51.6 |
| Chicago Fed Nat'l Activity Index | -- | -0.74 | -1.82 | -1.29 (July '08) | -1.77 | -0.35 | 0.05 |
| 3-Month Moving Average | -1.69 | -2.18 | -1.17 | -- | -- | -- | |
| Chicago Fed Midwest Factory Index | -- | 79.7 | 78.1 | 103.5 | 101.6 | 107.4 | 107.1 |
| Auto Sector | -- | 51.7 | 45.1 | 76.8 | 73.2 | 86.5 | 87.8 |
| Machinery Sector | -- | 91.6 | 93.6 | 126.4 | 125.3 | 127.7 | 129.1 |
by Louise Curley August 31, 2009
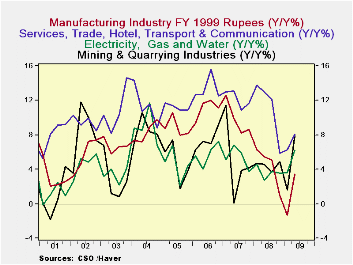 India's real gross domestic
product rose 6.1% in the second
quarter from the second quarter of 2008, up from the 5.8% year over
year growth in the first quarter. It was the first acceleration in
growth since the fourth quarter of 2007 when the global recession began
to affect the Indian economy. Among the industries contributing to the
acceleration in growth were manufacturing, mining and quarrying,
electricity gas and water and the service industries covering trade,
hotels, transport and communications. The year to year growth in these
industries is shown in the first chart.
India's real gross domestic
product rose 6.1% in the second
quarter from the second quarter of 2008, up from the 5.8% year over
year growth in the first quarter. It was the first acceleration in
growth since the fourth quarter of 2007 when the global recession began
to affect the Indian economy. Among the industries contributing to the
acceleration in growth were manufacturing, mining and quarrying,
electricity gas and water and the service industries covering trade,
hotels, transport and communications. The year to year growth in these
industries is shown in the first chart.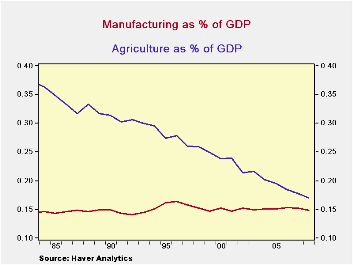
Earlier this year, the Reserve Bank of India forecasted that the economy would increase 6% in the fiscal year ending March 2010 while the Federal Government was estimating growth between 6.25% and 7.75%. Since then, the weak summer monsoon, reducing prospects for agriculture output, has cast doubts on these projections, Although agriculture has been declining in importance in the Indian economy for years (as can be seen in the second chart), it still accounts for a slightly larger portion of the economy than manufacturing. In fiscal 2008, agriculture accounted for 17% of total GDP and manufacturing for 15%. Agriculture output increased 2.4% in the second quarter over the corresponding period of 2008, down from the 2.7% increase in the first quarter. The recent announcement by the Farm ministry that 44% of the 625 administered districts reported drought or drought like conditions suggests a grim outlook for agriculture in the third quarter.
| Year/year Percent Change | Q2 09 | Q1 09 | Q4 08 | Q3 08 | Q2 08 | Q1 08 | Q4 07 | Q3 07 |
|---|---|---|---|---|---|---|---|---|
| Gross Domestic Product by Industry | 6.13 | 5.76 | 4.8 | 7.75 | 7.80 | 8.63 | 9.25 | 9.01 |
| Manufacturing | 3.45 | -1.36 | 0.90 | 5.08 | 5.50 | 6.29 | 8.62 | 8.23 |
| Mining and Quarrying | 7.88 | 1.60 | 4.90 | 3.70 | 4.61 | 4.67 | 4.16 | 3.83 |
| Electric, Gas, Water | 6.19 | 3.58 | 3.51 | 3.78 | 2.75 | 4.58 | 3.80 | 5.86 |
| Agriculture | 2.37 | 2.68 | -0.84 | 2.65 | 3.04 | 2.23 | 8.06 | 3.86 |
| Services | 7.70 | 8.41 | 9.53 | 9.77 | 9.99 | 11.28 | 10.21 | 10.68 |
| Construction | 7.10 | 6.79 | 4.16 | 9.56 | 8.44 | 6.90 | 9.70 | 13.4.0 |
| Trade, Hotels, Transport, Communications | 8.08 | 6.32 | 5.88 | 12.09 | 12.97 | 13.76 | 11.66 | 10.90 |
| Finance, Insurance, Real Estate & Business Services | 8.06 | 9.51 | 8.30 | 6.37 | 6.92 | 10.31 | 11.89 | 12.37 |
| Community, Social and Personal Services | 6.78 | 12.55 | 22.49 | 8.96 | 8.17 | 9.73 | 5.51 | 7.08 |

Tom Moeller
AuthorMore in Author Profile »Prior to joining Haver Analytics in 2000, Mr. Moeller worked as the Economist at Chancellor Capital Management from 1985 to 1999. There, he developed comprehensive economic forecasts and interpreted economic data for equity and fixed income portfolio managers. Also at Chancellor, Mr. Moeller worked as an equity analyst and was responsible for researching and rating companies in the economically sensitive automobile and housing industries for investment in Chancellor’s equity portfolio. Prior to joining Chancellor, Mr. Moeller was an Economist at Citibank from 1979 to 1984. He also analyzed pricing behavior in the metals industry for the Council on Wage and Price Stability in Washington, D.C. In 1999, Mr. Moeller received the award for most accurate forecast from the Forecasters' Club of New York. From 1990 to 1992 he was President of the New York Association for Business Economists. Mr. Moeller earned an M.B.A. in Finance from Fordham University, where he graduated in 1987. He holds a Bachelor of Arts in Economics from George Washington University.
More Economy in Brief


