 Global| Mar 01 2006
Rumors of Home Prices' Demise Exaggerated
by:Tom Moeller
|in:Economy in Brief
Summary
According to the Office of Federal Housing Enterprise Oversight (OFHEO), U.S. home prices rose last quarter at roughly the same rate as during the prior two years. The 2.9% q/q rise certainly was down from the upwardly revised 3.1% [...]
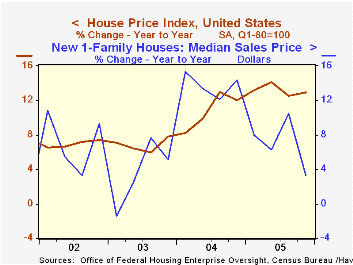
According to the Office of Federal Housing Enterprise Oversight (OFHEO), U.S. home prices rose last quarter at roughly the same rate as during the prior two years. The 2.9% q/q rise certainly was down from the upwardly revised 3.1% gain during the prior quarter and was down from a 4.6% quarterly jump during 3Q04, but the 4Q/4Q gain of 13.0% was near the series' peak. For all of 2005, the 13.2% rate of appreciation set a new record.
The House Price Indices in this report are weighted indexes based on repeat sales or refinancings using data provided by Fannie Mae or Freddie Mac.
Monday's report that median prices for new homes sold last year rose just 7.0%, roughly half the 2004 rate of growth, may suggest that fewer large expensive homes were sold during 2005 than during the prior year.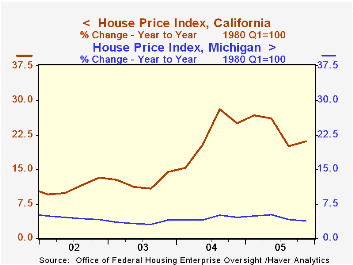
While rates of home price appreciation appear to have topped throughout the country, they have been steady. Moreover, the variance in the rates of growth between regions remained high.
During the last year, job cutbacks in the auto industry helped lower the 4Q/4Q rate of home price appreciation in Michigan to 3.8% and the state's gain has lagged all others. Conversely, California home prices logged a strong 4Q05 gain of 4.6% (21.1% y/y) while demographic trends raised Arizona home prices by 34.9% 4Q/4Q and Florida home prices by 26.8%.
During the last five years, home price appreciation in the District of Columbia surpassed all others at 16.9% per year followed closely by California at 16.2% per annum. Indiana at 3.8%, Nebraska at 4.2% and Michigan at 4.5% are at the bottom of the list. New Jersey (12.7%), New York ((11.5%) and Massachusetts (11.1%) ranked high but just behind Hawaii at 14.6% home price appreciation averaged during the last five years.
The latest report from the Office of Federal Housing Enterprise Oversight (OFHEO) can be found here.
| House Price Index (OFHEO) | 4Q '05 | 3Q '05 | Y/Y | 2005 | 2004 | 2003 |
|---|---|---|---|---|---|---|
| United States | 2.9% | 3.1% | 13.0% | 13.2% | 10.8% | 6.8% |
| California | 4.6% | 4.6% | 21.1% | 23.3% | 22.3% | 12.3% |
| New Jersey | 3.5% | 3.7% | 15.6% | 16.2% | 15.0% | 10.5% |
| Alabama | 2.5% | 2.1% | 9.2% | 7.9% | 4.1% | 4.1% |
| Michigan | 0.7% | 0.9% | 3.8% | 4.5% | 4.4% | 3.4% |

Tom Moeller
AuthorMore in Author Profile »Prior to joining Haver Analytics in 2000, Mr. Moeller worked as the Economist at Chancellor Capital Management from 1985 to 1999. There, he developed comprehensive economic forecasts and interpreted economic data for equity and fixed income portfolio managers. Also at Chancellor, Mr. Moeller worked as an equity analyst and was responsible for researching and rating companies in the economically sensitive automobile and housing industries for investment in Chancellor’s equity portfolio. Prior to joining Chancellor, Mr. Moeller was an Economist at Citibank from 1979 to 1984. He also analyzed pricing behavior in the metals industry for the Council on Wage and Price Stability in Washington, D.C. In 1999, Mr. Moeller received the award for most accurate forecast from the Forecasters' Club of New York. From 1990 to 1992 he was President of the New York Association for Business Economists. Mr. Moeller earned an M.B.A. in Finance from Fordham University, where he graduated in 1987. He holds a Bachelor of Arts in Economics from George Washington University.
More Economy in Brief


