 Global| Jul 20 2005
Rise in Mortgage Applications Due To Refinancing
by:Tom Moeller
|in:Economy in Brief
Summary
Total mortgage applications inched up 1.2% last week but remained down nearly 10% from the weekly high in early June, according to the Mortgage Bankers Association. For July so far, applications remained 1.7% ahead of the June average [...]
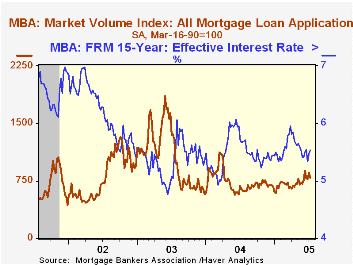
Total mortgage applications inched up 1.2% last week but remained down nearly 10% from the weekly high in early June, according to the Mortgage Bankers Association. For July so far, applications remained 1.7% ahead of the June average which rose 9.9% versus May.
Applications to refinance rose 2.5% and have been moving irregularly sideways since early last month. So far in July applications to refinance are 1.7% ahead of June when they rose 21.2% versus May.
Purchase applications slipped 0.1% w/w and marked the fourth decline in the last five weeks. So far in July purchase applications are 1.6% above June due to the large 9.1% jump during the first week of the month. During the last ten years there has been a 49% correlation between the y/y change in purchase applications and the change in new plus existing single family home sales.
The effective interest rate on a conventional 30-year mortgage rose to 5.94%, the highest level since mid-May. The effective rate on a 15-year mortgage also rose to 5.60%.
The Mortgage Bankers Association surveys between 20 to 35 of the top lenders in the U.S. housing industry to derive its refinance, purchase and market indexes. The weekly survey accounts for more than 40% of all applications processed each week by mortgage lenders. Visit the Mortgage Bankers Association site here.
Today's Testimony of Fed Chairman Alan Greenspan, the semiannual Monetary Policy Report to the Congress, is available here.
| MBA Mortgage Applications (3/16/90=100) | 07/15/05 | 07/08/05 | Y/Y | 2004 | 2003 | 2002 |
|---|---|---|---|---|---|---|
| Total Market Index | 801.1 | 791.9 | 29.6% | 735.1 | 1,067.9 | 799.7 |
| Purchase | 488.7 | 489.0 | 11.0% | 454.5 | 395.1 | 354.7 |
| Refinancing | 2,618.2 | 2,554.3 | 58.6% | 2,366.8 | 4,981.8 | 3,388.0 |
by Carol Stone July 20, 2005
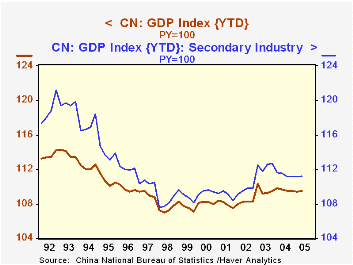
China's GDP remained strong in Q2, gaining 9.5% in real terms over Q2 2004, a pick-up from the 9.4% rate in Q1. Analysts in one leading forecast survey had looked for a slowing to 9.2%.
Manufacturing was a leading sector, as indicated in the advance in "secondary industry" shown in the table below, which similarly picked up in the quarter, rather than slowing down. It is not quite as vigorous as in 2003, but otherwise, factory and mining activity is maintaining the strongest trend since 1996. Data through May on nominal value added by industry indicate that so-called "heavy" industry is expanding at better than 35%, year-on-year, and "light" industry around 22% in recent months.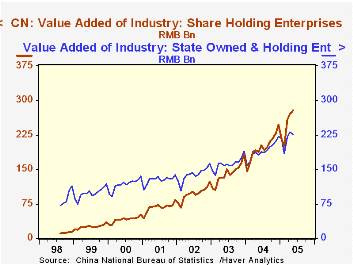
Interestingly, by types of ownership, the fastest growing industrial firms are the "share-holding enterprises", while value added by collectives and "joint ventures" actually decreased. State-owned and foreign-owned industrial firms are also showing sustained strength. A threshold of sorts was crossed in March 2004 when the value added by share-holding industrial enterprises surpassed that of state-owned firms; with a single exception. that has remained true every month since, and in May, the stock companies' value added exceeded that of the state-owned firms by more than 22%.
Other economic sectors remain firm, but relatively less vigorous. Primary industry (mostly agriculture) is up 5.0% in Q2, more than the 4.6% in Q1, but noticeably below the 6.3% for all of 2004. Tertiary activity, that is, mostly services, grew 7.8% in Q2, basically the pace that has prevailed since 1995.
| China | Q2 2005 | Q1 2005 | 2004 | 2003 | 2002 |
|---|---|---|---|---|---|
| GDP, Bil RMN | 3610.3 | 3131.9 | 3421.9 | 2934.8 | 2926.3 |
| Real Growth, Yr/Yr | 9.5 | 9.4 | 9.5 | 9.5 | 8.3 |
| Secondary Industry, Bil RMN | 2131.7 | 1831.8 | 1809.7 | 1531.8 | 1324.5 |
| Real Growth, Yr/Yr | 11.2 | 11.1 | 11.1 | 12.7 | 9.8 |

Tom Moeller
AuthorMore in Author Profile »Prior to joining Haver Analytics in 2000, Mr. Moeller worked as the Economist at Chancellor Capital Management from 1985 to 1999. There, he developed comprehensive economic forecasts and interpreted economic data for equity and fixed income portfolio managers. Also at Chancellor, Mr. Moeller worked as an equity analyst and was responsible for researching and rating companies in the economically sensitive automobile and housing industries for investment in Chancellor’s equity portfolio. Prior to joining Chancellor, Mr. Moeller was an Economist at Citibank from 1979 to 1984. He also analyzed pricing behavior in the metals industry for the Council on Wage and Price Stability in Washington, D.C. In 1999, Mr. Moeller received the award for most accurate forecast from the Forecasters' Club of New York. From 1990 to 1992 he was President of the New York Association for Business Economists. Mr. Moeller earned an M.B.A. in Finance from Fordham University, where he graduated in 1987. He holds a Bachelor of Arts in Economics from George Washington University.
More Economy in Brief


