 Global| Apr 11 2003
Retail Sales Surge
by:Tom Moeller
|in:Economy in Brief
Summary
Retail sales in March rose 2.1% and were much stronger than Consensus expectations for a 0.4% rise. The sales decline in February was lessened due to shallower declines in sales of building materials and apparel. Sales in 1Q rose at a [...]

Retail sales in March rose 2.1% and were much stronger than Consensus expectations for a 0.4% rise. The sales decline in February was lessened due to shallower declines in sales of building materials and apparel. Sales in 1Q rose at a 5.8% annual rate.
Sales excluding motor vehicles and parts dealers rose 1.1% versus Consensus expectations for a 0.4% rise. Nonauto sales rose at a 6.0% rate in 1Q.
Sales at gasoline service stations fell slightly last month after five huge monthly gains. Excluding gasoline, nonauto retail sales rose 1.2% in March and were up at a 3.7% annual rate last quarter.
Motor vehicle dealers' sales rose 5.3% and just about recouped the sharp declines in the prior two months. Unit sales of light vehicles rose 4.8% last month to 16.19 mil. (AR).
Furniture, home furnishing and electronics store sales recovered 0.9% in March following sharp declines in the three prior months. These sales fell at a 6.3% annual rate last quarter.
Sales at general merchandise stores rose 0.3% (4.1% y/y) for the fourth consecutive monthly gain.
Apparel store sales rose 1.1% (1.3% y/y) and a sharp decline in February was lessened to -1.4%.
Sales of building materials and garden equipment surged 7.9% (6.8% y/y). The steep decline in February was lessened to -5.8%.
| Mar | Feb | Y/Y | 2002 | 2001 | 2000 | |
|---|---|---|---|---|---|---|
| Retail Sales & Food Services | 2.1% | -1.3% | 5.3% | 3.3% | 3.9% | 6.7% |
| Excluding Autos | 1.1% | -0.6% | 4.8% | 3.9% | 3.4% | 7.3% |
by Tom Moeller April 11, 2003
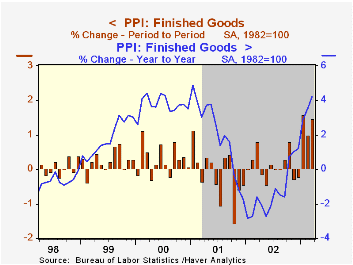
Finished producer prices surged 1.5% in March. The jump followed strong gains in each of the prior two months. Consensus expectations were for a 0.3% gain.
Finished energy prices surged 5.7% (26.5% y/y) and rose at a 54.0% annual rate in 1Q. Gasoline prices rose 6.9% (54.7% y/y) following double digit gains during the prior two months. Fuel oil prices rose 10.7% (85.5% y/y). Residential gas prices surged 13.5% (36.4% y/y). These energy product price series are NSA.
Finished food prices rose 0.1% (-0.6% y/y). It was the sixth consecutive monthly increase.
Excluding food and energy, prices were quite a bit stronger than expectations for no change. The 0.7% gain followed declines in six of the prior eight months.
Core finished consumer goods prices rose 0.7% (1.2% y/y) and recouped all of the prior month's 0.5% decline. The gain mostly reflected a 2.5% increase in passenger car prices. Other durable consumer goods prices fell as did prices for core consumer nondurables. Capital goods prices jumped 0.8% (0.4% y/y) mostly reflecting strength in ship and light truck prices.
Intermediate goods prices were strong again but the gain in core intermediate prices eased substantially.
Crude goods prices surged by the most for any one month since January 2001. The gain did reflect a 30.5% jump in energy prices but also reflected a 1.0% jump in core crude prices, the fourth strong gain in five months.
| Producer Price Index | Mar | Feb | Y/Y | 2002 | 2001 | 2000 |
|---|---|---|---|---|---|---|
| Finished Goods | 1.5% | 1.0% | 4.2% | -1.3% | 2.0% | 3.7% |
| Core | 0.7% | -0.5% | 0.9% | 0.1% | 1.4% | 1.3% |
| Intermediate Goods | 2.0% | 2.1% | 8.1% | -1.5% | 0.4% | 4.9% |
| Core | 0.2% | 0.7% | 2.6% | -0.5% | -0.1% | 2.6% |
| Crude Goods | 13.3% | 4.8% | 47.1% | -10.5% | 0.3% | 22.8% |
| Core | 1.0% | 2.7% | 15.1% | 3.8% | -10.0% | 7.4% |
by Tom Moeller April 11, 2003

The mid-April reading of Consumer Sentiment from the University of Michigan rose 7.2% versus March. The reading of 83.2 was versus Consensus expectations for 77.0 and follows improvement in the latter part of March.
The index of current conditions and of expectations both rose sharply.
Over the last 10 years there has been a 63% correlation between the level of consumer sentiment and the y/y change in real PCE. That correlation rose to 82% during the last five years.
The University of Michigan survey is not seasonally adjusted.It is based on telephone interviews with 250 households nationwide on personal finances and business and buying conditions. The survey is expanded to a total of 500 interviews at month end.
| University of Michigan | Mid-April | Mar | Y/Y | 2002 | 2001 | 2000 |
|---|---|---|---|---|---|---|
| Consumer Sentiment | 83.2 | 77.6 | -10.5% | 89.6 | 89.2 | 107.6 |

Tom Moeller
AuthorMore in Author Profile »Prior to joining Haver Analytics in 2000, Mr. Moeller worked as the Economist at Chancellor Capital Management from 1985 to 1999. There, he developed comprehensive economic forecasts and interpreted economic data for equity and fixed income portfolio managers. Also at Chancellor, Mr. Moeller worked as an equity analyst and was responsible for researching and rating companies in the economically sensitive automobile and housing industries for investment in Chancellor’s equity portfolio. Prior to joining Chancellor, Mr. Moeller was an Economist at Citibank from 1979 to 1984. He also analyzed pricing behavior in the metals industry for the Council on Wage and Price Stability in Washington, D.C. In 1999, Mr. Moeller received the award for most accurate forecast from the Forecasters' Club of New York. From 1990 to 1992 he was President of the New York Association for Business Economists. Mr. Moeller earned an M.B.A. in Finance from Fordham University, where he graduated in 1987. He holds a Bachelor of Arts in Economics from George Washington University.


