 Global| Jul 15 2003
Retail Sales Rose As Expected
by:Tom Moeller
|in:Economy in Brief
Summary
Retail sales rose an expected 0.5% in June following just a slight increase in May. The May figures were little revised. Sales excluding motor vehicles and parts dealers rose a strong 0.7%, more than twice Consensus expectations for a [...]
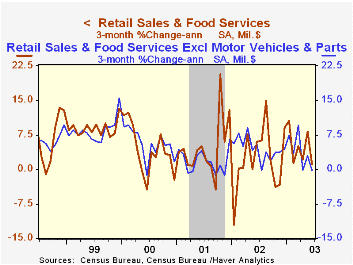
Retail sales rose an expected 0.5% in June following just a slight increase in May. The May figures were little revised.
Sales excluding motor vehicles and parts dealers rose a strong 0.7%, more than twice Consensus expectations for a 0.3% gain. The slight increase in May was little revised.
Sales gains were widespread last month. Apparel and accessory stores added 1.3% (2.9% y/y) to the 1.6% May sales spurt that was revised up. Furniture, home furnishing and electronics store sales increased 0.2% (3.4% y/y) following a 1.4% May gain which was weaker than the 2.0% rise reported last month. Sales at general merchandise stores rose 0.3% (2.4% y/y) following an unrevised 0.7% May gain.
Sales of building materials and garden supplies surged 2.6% (6.1% y/y). Excluding these categories, nonauto retail sales rose 0.5% (3.5% y/y).
Motor vehicle dealers' sales fell 0.1% for the second consecutive monthly decline. Unit sales of light vehicles rose 1.9% last month to 16.43 mil. (AR). Sales at gasoline service stations rose 1.3% following two months of sharp decline.
| June | May | Y/Y | 2002 | 2001 | 2000 | |
|---|---|---|---|---|---|---|
| Retail Sales & Food Services | 0.5% | 0.0% | 4.2% | 3.2% | 2.9% | 6.7% |
| Excluding Autos | 0.7% | 0.1% | 3.8% | 3.7% | 2.9% | 7.4% |
by Tom Moeller July 15, 2003
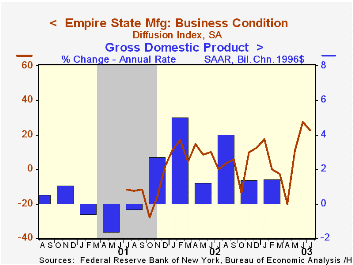
The Empire State Manufacturing Survey indicated the third month of improvement for area manufacturers. The index of general business conditions fell somewhat to 22.56 in July but remained near the series' highs.
Consensus expectations were for a reading of 25.0. The data were reported by the Federal Reserve Bank of New York.
New orders sustained nearly all of the June surge while shipments improved to a series high. Offsetting this strength was sharp deterioration in the unfilled orders and employment indexes which both fell back into negative territory.
The index of prices paid improved to 6.45 versus the negative reading of June.
The survey includes measures of business expectations six months ahead. This diffusion index fell to 52.5 but for the last three months is much improved from the lows of the February-to-April period. Expectations for capital expenditures rose.
The Empire State Manufacturing Survey is a monthly survey of manufacturers in New York State conducted by the Federal Reserve Bank of New York. Participants from across the state in a variety of industries respond to a questionnaire and report the change in a variety of indicators from the previous month. Respondents also state the likely direction of these same indicators six months ahead. April 2002 is the first report, although survey data date back to July 2001.
Like the Philadelphia Fed Index of General Business Conditions, the Empire State Business Conditions Index reflects answers to an independent survey question, not the components.
For the latest Empire State Manufacturing Survey report, click here.
| Empire State Manufacturing Survey | July | June | Y/Y | 2002 | 2001 |
|---|---|---|---|---|---|
| General business conditions (diffusion index) | 22.56 | 27.60 | 0.21 | 7.10 | -13.02 |
by Tom Moeller July 15, 2003
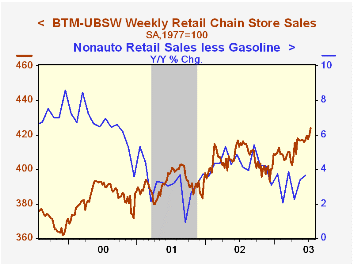
Chain store sales added 0.9% last week to the 0.7% jump the week prior, according to the BTM-UBSW survey.
Sales started July 1.1% ahead of June which were barely changed from May.
During the last five years there has been a 60% correlation between the year-to-year percent change in chain store sales and the change in nonauto retail sales less gasoline.
The BTM leading indicator of chain store sales fell 0.5% in early July. It was the fourth decline in the last five weeks for this indicator.
The BTM-UBSW retail chain-store sales index is constructed from the sales results reported by seven retailers: Dayton Hudson, Federated, Kmart, May, J.C. Penney, Sears and Wal-Mart.
| BTM-UBSW (SA, 1977=100) | 7/12/03 | 7/5/03 | Y/Y | 2002 | 2001 | 2000 |
|---|---|---|---|---|---|---|
| Total Weekly Retail Chain Store Sales | 423.9 | 420.1 | 2.3% | 3.6% | 2.1% | 3.4% |

Tom Moeller
AuthorMore in Author Profile »Prior to joining Haver Analytics in 2000, Mr. Moeller worked as the Economist at Chancellor Capital Management from 1985 to 1999. There, he developed comprehensive economic forecasts and interpreted economic data for equity and fixed income portfolio managers. Also at Chancellor, Mr. Moeller worked as an equity analyst and was responsible for researching and rating companies in the economically sensitive automobile and housing industries for investment in Chancellor’s equity portfolio. Prior to joining Chancellor, Mr. Moeller was an Economist at Citibank from 1979 to 1984. He also analyzed pricing behavior in the metals industry for the Council on Wage and Price Stability in Washington, D.C. In 1999, Mr. Moeller received the award for most accurate forecast from the Forecasters' Club of New York. From 1990 to 1992 he was President of the New York Association for Business Economists. Mr. Moeller earned an M.B.A. in Finance from Fordham University, where he graduated in 1987. He holds a Bachelor of Arts in Economics from George Washington University.


