 Global| Jul 31 2009
Rate of U.S. GDP Decline Slows inQ2 2009
by:Tom Moeller
|in:Economy in Brief
Summary
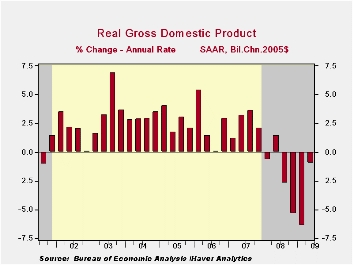
The Commerce Department indicated that real GDP declined last quarter at a 1.0% annual rate, indicating a slowing in the U.S. recession. The diminution in the rate of GDP decline versus the prior two quarters was due to a reduced rate [...]
 The
Commerce
Department indicated that real GDP declined last quarter at a 1.0%
annual rate, indicating a slowing in the U.S. recession. The diminution
in the rate of GDP decline versus the prior two quarters was due to a
reduced rate of inventory decumulation and a smaller shortfall in
domestic sales. The 2Q reading compares to Consensus expectations for a
1.5% decline. Revisions to past data, nonetheless, indicate a greater
decline in GDP for all of the current recession. It now amounts to a
3.7% drop since the official peak in 4Q '07. Also, comprehensive
revision of the National Income Accounts, the first since 2003,
incorporate some restructuring of PCE categories and a new impact of
natural disasters. In addition there are new input-output tables and
re-indexing to 2005=100.
The
Commerce
Department indicated that real GDP declined last quarter at a 1.0%
annual rate, indicating a slowing in the U.S. recession. The diminution
in the rate of GDP decline versus the prior two quarters was due to a
reduced rate of inventory decumulation and a smaller shortfall in
domestic sales. The 2Q reading compares to Consensus expectations for a
1.5% decline. Revisions to past data, nonetheless, indicate a greater
decline in GDP for all of the current recession. It now amounts to a
3.7% drop since the official peak in 4Q '07. Also, comprehensive
revision of the National Income Accounts, the first since 2003,
incorporate some restructuring of PCE categories and a new impact of
natural disasters. In addition there are new input-output tables and
re-indexing to 2005=100.
Though its magnitude diminished somewhat last quarter to 0.8 percentage points, the reduction of unwanted inventories has been a major force behind this recession. Three factors are behind the large size: 1) The size of the shortfall in final sales, 2) No inclination to hold inventories due to rising prices and 3) Tighter inventory management systems. The negative contribution from inventories this recession rivals the early-1980s.
 Improvement in the foreign
trade sector helped the domestic economy last quarter, but for reasons
that emphasize the weakness in global activity. Improvement in real net
exports added 1.4 percentage points to 2Q GDP growth after a 2.6 point
addition during 1Q. That addition occurred because a 7.0% (-15.7% y/y)
decline in exports was accompanied by a 15.1% (-18.6% y/y) decline in
imports. Credit storm sinking global trade
from the Federal Reserve Bank of Atlanta is available here.
Improvement in the foreign
trade sector helped the domestic economy last quarter, but for reasons
that emphasize the weakness in global activity. Improvement in real net
exports added 1.4 percentage points to 2Q GDP growth after a 2.6 point
addition during 1Q. That addition occurred because a 7.0% (-15.7% y/y)
decline in exports was accompanied by a 15.1% (-18.6% y/y) decline in
imports. Credit storm sinking global trade
from the Federal Reserve Bank of Atlanta is available here.
Domestic demand remained under pressure last quarter, but
the negative forces eased somewhat from earlier in the recession. After
having declined over 3% in each of the final quarters of 2008, real
personal consumption expenditures last quarter slipped at a 1.2% annual
rate (-1.8% y/y), following a 0.6% 1Q decline. 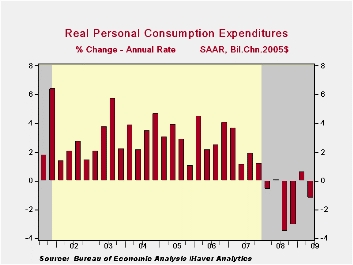 The auto sector
exemplifies this moderation in decline. Spending on motor vehicles fell
at an 11.9% rate in 2Q after a 6.7% 1Q gain, compared to quarterly
declines between 20% and 40% last year. Weak corporate profits,
however, continue to prompt weakness in business fixed investment which
fell last quarter at an 8.9% rate (-19.5% y/y). These figures, however,
compare favorably to the severely depressed activity in the housing
sector. Residential investment fell last quarter at a 29.3% annual rate
(-27.1% y/y) which was every bit like the declines since late-2006.
The auto sector
exemplifies this moderation in decline. Spending on motor vehicles fell
at an 11.9% rate in 2Q after a 6.7% 1Q gain, compared to quarterly
declines between 20% and 40% last year. Weak corporate profits,
however, continue to prompt weakness in business fixed investment which
fell last quarter at an 8.9% rate (-19.5% y/y). These figures, however,
compare favorably to the severely depressed activity in the housing
sector. Residential investment fell last quarter at a 29.3% annual rate
(-27.1% y/y) which was every bit like the declines since late-2006.
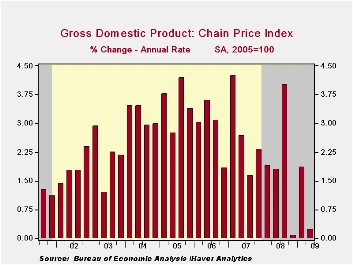
Finally, improved spending by the government sector helped to offset weakness in private sector spending. A 5.6% 2Q increase (2.2% y/y) was the strongest since 2003. It was fueled by a 10.9% (6.4% y/y) gain in Federal spending which reflected a 13.3 (3.2% y/y) rise in defense expenditures. Even spending by states and localities rose for the first time in three quarters (-0.3% y/y).Pricing power has suffered as a result of economic weakness. The chained GDP price deflator rose at just a 0.2% annual rate last quarter and the uptick pulled the y/y gain down to 1.6% which was its weakest since 2002. Expectations had been for a 1.0% quarterly rise. Domestic prices, however, were even weaker. The 0.7% uptick followed a sharp 1Q decline and pulled the y/y change to a negative 0.3%. The PCE price index recovered all of a 1Q decline but the y/y decline of 0.2% is the weakest price performance since 1950. The residential investment chain price index made up half of the 1Q decline and remained down a near-record 4.0% y/y. The weakness in business spending caused the nonresidential investment price index to fall for the second straight quarter (+0.9% y/y).
The U.S. National Income & Product Account data is available in Haver's USECON and the USNA databases.
| Chained 2005$, % AR | 2Q '09 (Advance) | 1Q '09 (Final) | 4Q '08 | 2Q Y/Y | 2008 | 2007 | 2006 |
|---|---|---|---|---|---|---|---|
| GDP | -1.0 | -6.4 | -5.4 | -3.9 | 0.4 | 2.1 | 2.7 |
| Inventory Effect | -0.8 | -2.4 | -0.6 | -0.9 | -0.4 | -0.4 | 0.1 |
| Final Sales | -0.2 | -4.1 | -4.7 | -3.0 | 0.8 | 2.5 | 2.6 |
| Foreign Trade Effect | 1.4 | 2.6 | -0.1 | 0.9 | -1.2 | 0.8 | 0.1 |
| Domestic Final Demand | -1.5 | -6.4 | -4.9 | -3.9 | -0.4 | 1.7 | 2.5 |
| Chained GDP Price Index | 0.2 | 1.9 | 0.1 | 1.5 | 2.1 | 2.9 | 3.3 |
by Robert Brusca July 31, 2009
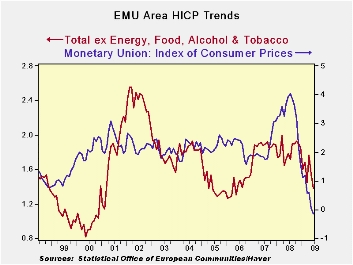
Inflation remains under control in the EMU region in July.
Despite ECB concerns about inflation and German and other concerns
about the degree of stimulus money supply growth remains very tepid in
the EMU region and inflation continues to drop. In July the FLASH HICP
(a figure for which there are no details available) fell by 0.2%.
Overall inflation on this measure is a negative 0.6% over 12-months and
is running at a pace of zero over three months.
HICP inflation has fallen in two of the last three months in
Germany. German inflation is down by 0.7% over 12-months. Inflation
even fell in Italy in July and prices in Italy are falling over
12-months as well.
On balance the news from Europe is quite good on the inflation
front. Japan also reported out a decline in CPI prices. For Japan it
was June inflation falling by 1.7% Yr/Yr.
Growth: both sides of the pond
The US GDP report reverberated with signs that the slowdown is abating
as US exports cut the rate of descent and most US GDP components cut
their rate of descent as well. US GDP dropped at just a 1% annual rate,
making positive growth in Q3 a real possibility. The fact that nearly
all GDP components in the US cut their pace of decline is a good sign.
The fact that inflation remains under control throughout the global
economy is another good sign. The data from the EU Commission yesterday
reminded us that although ‘things’ are improving the diffusion readings
on growth by sector show that that contraction is overwhelmingly the
name of the game across Europe. The US alone looks poised to break the
growth barrier any minute.
Growth, inflation and central banks
Today is a day when we are getting some of the news we have been
waiting on for a long time. It is still not clear how much of an
inflation threat we have when the US economy turns around. For now the
growth turnaround appears to be nearly at hand. Inflation appears to
still be well under wraps. It seems that the world’s central banks are
in a good a position to look at what they have done and to make the
needed adjustments without creating one sort of chaos or another. But
you never can tell until they have done something. The one fly in the
ointment is the still large external imbalances and the behavior of
exchange rates. Everyone seems to want a weak currency and
mathematically it just is not possible. This will be the market to keep
close watch on as things begin to improve.
| Trends in EMU HICP; Flash Index | |||||||
|---|---|---|---|---|---|---|---|
| % mo/mo | % saar | ||||||
| Jul-09 | Jun-09 | May-09 | 3-Mo | 6-Mo | 12-Mo | Yr Ago | |
| EMU-13 | -0.2% | 0.3% | 0.0% | 0.0% | 0.3% | -0.6% | 4.0% |
| Core | #N/A | 0.1% | 0.0% | 1.0% | 0.9% | 1.3% | 2.5% |
| Goods | #N/A | 0.3% | 0.1% | 2.8% | 1.1% | -1.5% | 5.0% |
| Services | #N/A | 0.1% | 0.1% | 2.2% | 1.2% | 1.9% | 2.5% |
| HICP | |||||||
| Germany | -0.4% | 0.5% | -0.2% | -0.4% | 0.0% | -0.7% | 3.5% |
| France | #N/A | 0.2% | 0.0% | 0.3% | 0.3% | -0.6% | 4.0% |
| Italy | -0.6% | 0.3% | 0.0% | -1.1% | 0.7% | -0.1% | 4.1% |
| Spain | #N/A | 0.4% | -0.1% | 1.0% | -0.5% | -1.0% | 5.0% |
| Core excl FE&A | |||||||
| Germany | #N/A | 0.2% | -0.1% | 1.5% | 1.3% | 1.2% | 1.7% |
| Italy | #N/A | 0.1% | 0.1% | 1.1% | 0.9% | 1.6% | 3.0% |
| Spain | #N/A | 0.2% | 0.0% | 0.8% | -0.3% | 0.8% | 3.4% |
| Blue shaded area data trail by one month | |||||||
by Carol Stone July 31, 2009
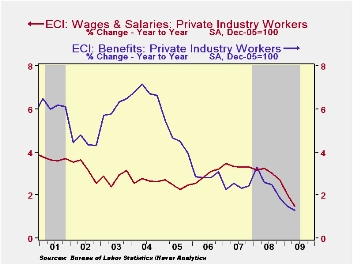
Employment compensation remained sluggish in Q2, although it picked up slightly. The total employment cost index rose 0.4%, following Q1's 0.3% and also a bit better than expectations for 0.3%. However, the improvement came in state and local government workers, who saw a 1.0% rise compared with 0.8% in Q1; private industry workers' compensation had a second consecutive record-small 0.2% increase. On a year-to-year basis, the total slower more, with a rise of just 1.8% from 2.1% in Q1.
Wage and salary growth also ticked up from 0.3% in Q1 to 0.4%
in Q2. As with total compensation, the "gain" occurred among state and
local governments, which went from 0.7% to 1.0%. Private sector workers
got a slim 0.2% raise, the same as the quarter before.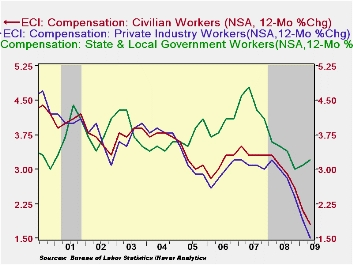
These gains for state and local governments are interesting. Both major categories had a marked acceleration in wages. Public administration went from 0.8% in Q1 to 1.2% in Q2, and education and health services from 0.5% to 0.9%. The public administration number is the strongest since Q4 2006, while education and health is marginally more than the recent trends. In light of recent budget pressures in that sector, these labor cost increases would seem to be unsustainable.
Total benefit costs for all civilian workers slowed to a 0.3% increase in Q2 from 0.5% in Q1. This produced a 1.8% year-to-year increase; it is the lowest since mid-1997, but not worse than that period. The associated non-published information on health benefit costs showed a 4.4% rise in the latest 12 months, about in line with the trends of the last two or three years.
The employment cost index figures are available in Haver's USECON database.
| ECI - Private Industry Workers (%) | 2Q '09 | 1Q '09 | 4Q '08 | 2Q Y/Y | 2008 | 2007 | 2006 |
|---|---|---|---|---|---|---|---|
| Compensation | 0.2 | 0.2 | 0.5 | 1.5 | 2.8 | 3.1 | 2.9 |
| Wages & Salaries | 0.2 | 0.2 | 0.5 | 1.5 | 3.0 | 3.4 | 2.9 |
| Benefit Costs | 0.2 | 0.2 | 0.4 | 1.3 | 2.6 | 2.4 | 2.9 |

Tom Moeller
AuthorMore in Author Profile »Prior to joining Haver Analytics in 2000, Mr. Moeller worked as the Economist at Chancellor Capital Management from 1985 to 1999. There, he developed comprehensive economic forecasts and interpreted economic data for equity and fixed income portfolio managers. Also at Chancellor, Mr. Moeller worked as an equity analyst and was responsible for researching and rating companies in the economically sensitive automobile and housing industries for investment in Chancellor’s equity portfolio. Prior to joining Chancellor, Mr. Moeller was an Economist at Citibank from 1979 to 1984. He also analyzed pricing behavior in the metals industry for the Council on Wage and Price Stability in Washington, D.C. In 1999, Mr. Moeller received the award for most accurate forecast from the Forecasters' Club of New York. From 1990 to 1992 he was President of the New York Association for Business Economists. Mr. Moeller earned an M.B.A. in Finance from Fordham University, where he graduated in 1987. He holds a Bachelor of Arts in Economics from George Washington University.
More Economy in Brief


