 Global| Apr 18 2006
PPI Moderate, As Expected
by:Tom Moeller
|in:Economy in Brief
Summary
The finished goods producer price index for March rose a moderate 0.5% following the unrevised 1.4% decline one month earlier. Consensus expectations had been for a 0.4% gain. Less food & energy the PPI (core) also was moderate and [...]
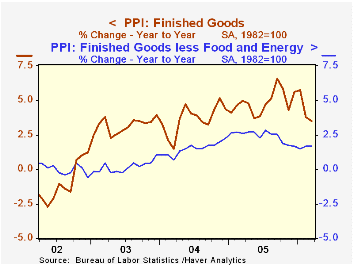
The finished goods producer price index for March rose a moderate 0.5% following the unrevised 1.4% decline one month earlier. Consensus expectations had been for a 0.4% gain.
Less food & energy the PPI (core) also was moderate and increased 0.1%, half the expected rise. Durable consumer goods rose 0.1% (0.5% y/y) for the second consecutive month and nondurables prices continued weak due to declines in apparel prices & textile house furnishings. Prices of all finished consumer goods less food & energy rose 0.2% (1.9% y/y) for the second month and core consumer nondurable goods prices increased 0.2% (2.9% y/y), half the prior month's increase.
Capital equipment prices increased just 0.1% (1.4% y/y) for the second consecutive month.
Finished energy prices during March increased 1.8% (15.6% y/y) as gasoline prices jumped 9.1% (22.2% y/y) but home heating oil fell for the third straight month, down 3.6% (+15.2% y/y) along with natural gas prices which dipped another 0.5% (+22.3% y/y). Residential electric power costs fell 0.7% (+7.9% y/y).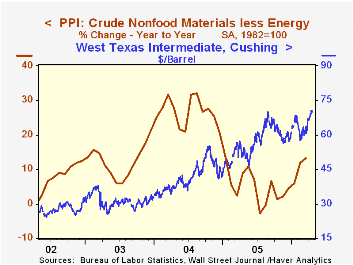
The Short-Term Energy and Summer Fuels Outlook from the US Energy Information Administration can be found here. Also available is the U.S. Energy Prices: Base Case.
Intermediate goods prices fell for the second consecutive month. Core intermediate prices also were tame and rose just 0.1% following the 0.5% surge during February.
Crude goods prices dropped sharply again due to lower energy prices, which fell 4.5%. This month, however, crude oil prices have backed up with the price of WTI crude oil yesterday at $70.41 per barrel versus the March average of $62.90. Core crude prices were strong last month and rose 0.8% due to continued strength in prices for copper base scrap (57.6% y/y), aluminum scrap (25.5% y/y) and iron & steel scrap (10.7% y/y). During the last thirty years "core" crude prices have been a fair indicator of industrial sector activity with a 48% correlation between the six month change in core crude prices and the change in factory sector industrial production.
| Producer Price Index | Mar | Feb | Y/Y | 2005 | 2004 | 2003 |
|---|---|---|---|---|---|---|
| Finished Goods | 0.5% | -1.4% | 3.5% | 4.9% | 3.6% | 3.2% |
| Core | 0.1% | 0.3% | 1.7% | 2.4% | 1.5% | 0.2% |
| Intermediate Goods | -0.1% | -0.3% | 7.0% | 8.0% | 6.6% | 4.7% |
| Core | 0.1% | 0.5% | 4.5% | 5.5% | 5.7% | 2.0% |
| Crude Goods | -2.7% | -9.2% | 4.9% | 14.7% | 17.5% | 25.1% |
| Core | 0.8% | 3.3% | 13.2% | 4.8% | 26.5% | 12.4% |
by Tom Moeller April 18, 2006
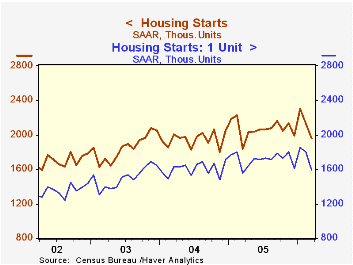
Housing starts last month fell another 7.8% m/m to 1.960M units following the like decline during February that was little revised. The drop by far exceeded Consensus expectations for a decline to 2.04M starts.
Lower single-family starts led the weakness last month with a 12.0% drop to 1.591M, the lowest level in one year. 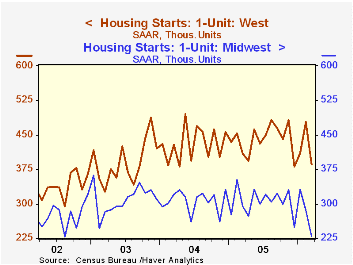
Single family housing starts in the West were notably weak and registered a 19.4% (-5.6% y/y) decline to one of the lowest levels in the last two years. In the Midwest single family starts also fell sharply by 19.6% (-22.0% y/y). In the South fell hard for the second month, by 7.0%, but remained up 17.3% y/y while in Northeast starts slipped a moderate 2.7% (+4.4% y/y).
Multi family starts made up half of the prior month's decline with a 15.7% increase into the middle of the range of the last two and one half years.
Building permits fell for the second consecutive month and single family permits fell hard again, by 6.9% (-0.6% y/y) to the lowest level since late 2003.
| Housing Starts (000s, AR) | Mar | Feb | Y/Y | 2005 | 2004 | 2003 |
|---|---|---|---|---|---|---|
| Total | 1,960 | 2,126 | 6.9% | 2,072 | 1,950 | 1,854 |
| Single-family | 1,591 | 1,807 | 2.6% | 1,716 | 1,604 | 1,505 |
| Multi-family | 369 | 319 | 30.4% | 355 | 345 | 349 |
| Building Permits | 2,059 | 2,179 | 1.9% | 2,122 | 2,058 | 1,8 88 |
by Tom Moeller April 18, 2006
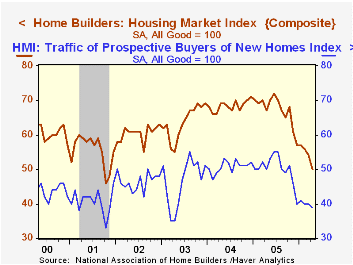
The April level of the National Association of Home Builders' (NAHB) Composite Housing Market Index fell 7.4% and the latest level is down 30.6% since the high last June. It also was the lowest level since November 2001.
During the last twenty years there has been an 82% correlation between the y/y change in the annual composite index and the change in single family housing starts and there has been a 75% correlation between the current sales index and new single family home sales.
The April index for current sales of single family homes dropped 8.5% (-26.0% y/y) and the index for sales in six months dropped 6.5% (-23.7% y/y).
An index of the traffic of prospective home buyers was at the lowest level since early 2003.
The NAHB index is a diffusion index based on a survey of builders. Readings above 50 signal that more builders view conditions as good than poor.
Visit the National Association of Home Builders.
| Nat'l Association of Home Builders | April | Mar | April '05 | 2005 | 2004 | 2003 |
|---|---|---|---|---|---|---|
| Composite Housing Market Index | 50 | 54 | 67 | 67 | 68 | 64 |
by Tom Moeller April 18, 2006
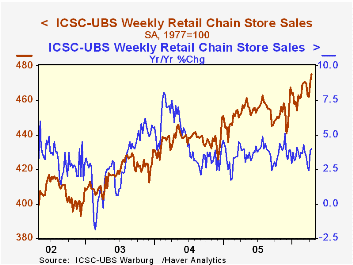
Chain store sales jumped another 1.1% last week, according to the International Council of Shopping Centers (ICSC)-UBS survey, on top of the 1.8% rise which opened April.
The gains raised sales so far in April 1.3% above the March average which rose 0.7% from February.
During the last ten years there has been a 47% correlation between the y/y change in chain store sales and the change in nonauto retail sales less gasoline.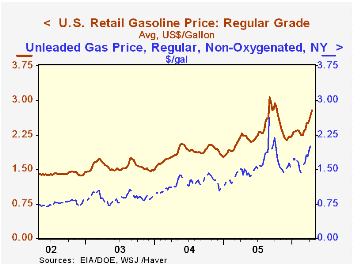
The ICSC-UBS retail chain-store sales index is constructed using the same-store sales (stores open for one year) reported by 78 stores of seven retailers: Dayton Hudson, Federated, Kmart, May, J.C. Penney, Sears and Wal-Mart.
Again the rise in store sales accompanied a jump in retail gasoline prices. The second consecutive ten cent w/w surge in gas to $2.78 per gallon (24.4% y/y) raised the April average to $2.69. In spot market trading yesterday gasoline prices easily crested two dollars and rose to $2.14.
| ICSC-UBS (SA, 1977=100) | 04/15/06 | 04/08/06 | Y/Y | 2005 | 2004 | 2003 |
|---|---|---|---|---|---|---|
| Total Weekly Chain Store Sales | 475.6 | 470.6 | 4.0% | 3.6% | 4.7% | 2.9% |
by Louise Curley April 18, 2006
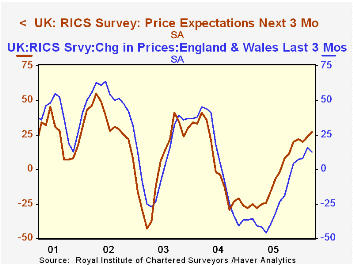
The housing market in England and Wales is showing improvement. The RICS (Royal Institute of Chartered Surveyors) survey of the housing market shows that although the pace has slackened, house prices continue to rise and expectations of price increases are becoming stronger as can be seen in the first chart.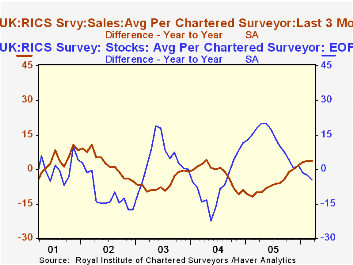
The RICS survey, which was released today is an excellent source of information on many aspects of the housing market in England and Wales. It is found in Haver's UK data base and in INTSRVYS-G10+ Country Surveys.
There are data on the average units sold and the average stock of units held per chartered surveyor and the relation of sales to stocks. The average units sold has improved and in March was 16.4% above the units sold in March 2005. Over the same period the stock of units held has declined by 5.9%. The second chart shows the year over year percentage change in the average units sold and the average stock of units per chartered surveyor. Although we do not have the absolute levels of sales and stocks of housing units, the rising trend of sales and declining trend of stocks suggests an improving supply and demand situation.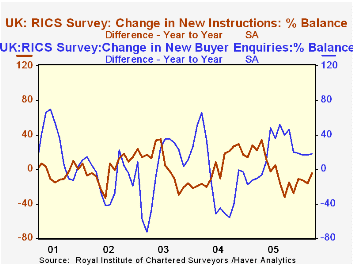
The same sort of relative improvement in the housing market can be seen in the year to year difference in the percent balances of new buyer enquiries and the new offerings by sellers. (See the third chart.) The year to year difference in the percent balance of new buyer enquiries has been positive since early 2005, while the year to year difference in the percent balance on new offering by sellers has been negative.
| England and Wales: RICS Survey |
Mar 06 | Feb 06 | Mar 05 | M/M % | Y/Y % | 2004 | 2003 | 2002 |
|---|---|---|---|---|---|---|---|---|
| Units | ||||||||
| Average Stock per Surveyor | 72.2 | 71.7 | 76.7 | 0.70 | -5.87 | 75.8 | 64.1 | 70.1 |
| Average Sales per Surveyor | 25.5 | 24.9 | 21.9 | 2.41 | 16.44 | 22.5 | 28.5 | 30.7 |
| Percent Balance | Mar 06 | Feb 06 | Mar 05 | M/M dif | Y/Y dif | 2004 | 2003 | 2002 |
| Actual House Prices | 11 | 10 | -7 | 1 | 18 | 6 | -12 | -5 |
| Expected House Prices | 27 | 24 | -28 | 3 | 55 | -8 | 4 | 3 |
| Expected Sales next 3 months | 28 | 24 | 24 | 4 | 4 | 28 | 19 | 18 |
| Newly Agreed Sales | 17 | 12 | -7 | 5 | 24 | 2 | -9 | -2 |
| New Buyer Enquiries | 11 | 10 | -7 | 1 | 18 | 6 | -12 | -5 |
| New Stock | 13 | 8 | 18 | 5 | -5 | 11 | 10 | 8 |

Tom Moeller
AuthorMore in Author Profile »Prior to joining Haver Analytics in 2000, Mr. Moeller worked as the Economist at Chancellor Capital Management from 1985 to 1999. There, he developed comprehensive economic forecasts and interpreted economic data for equity and fixed income portfolio managers. Also at Chancellor, Mr. Moeller worked as an equity analyst and was responsible for researching and rating companies in the economically sensitive automobile and housing industries for investment in Chancellor’s equity portfolio. Prior to joining Chancellor, Mr. Moeller was an Economist at Citibank from 1979 to 1984. He also analyzed pricing behavior in the metals industry for the Council on Wage and Price Stability in Washington, D.C. In 1999, Mr. Moeller received the award for most accurate forecast from the Forecasters' Club of New York. From 1990 to 1992 he was President of the New York Association for Business Economists. Mr. Moeller earned an M.B.A. in Finance from Fordham University, where he graduated in 1987. He holds a Bachelor of Arts in Economics from George Washington University.


