 Global| Jul 20 2006
Philadelphia Fed Business Activity Index Lowest Since January
by:Tom Moeller
|in:Economy in Brief
Summary
The Philadelphia Federal Reserve Bank's July Index of General Business Conditions in the manufacturing sector dropped to 6.0 from an unrevised 13.1 during June. The decline exceeded Consensus expectation for a drop to 12.4. The July [...]
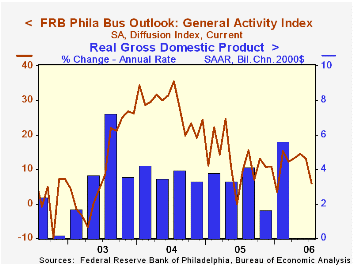
The Philadelphia Federal Reserve Bank's July Index of General Business Conditions in the manufacturing sector dropped to 6.0 from an unrevised 13.1 during June. The decline exceeded Consensus expectation for a drop to 12.4.
The July decline was to the lowest level since this past January.
During the last ten years there has been a 65% correlation between the level of the Philadelphia Fed Business Conditions Index and three month growth in factory sector industrial production. There has been a 49% correlation with q/q growth in real GDP.
The lower index reflected declines in the sub indexes of new orders, shipments, unfilled orders and delivery times. Moving in the other direction, the employment index advanced to its highest level in three months. During the last ten years there has been a 75% correlation between the employment index and the three month growth in factory payrolls.
The business conditions index reflects a separate survey question, not the sub indexes.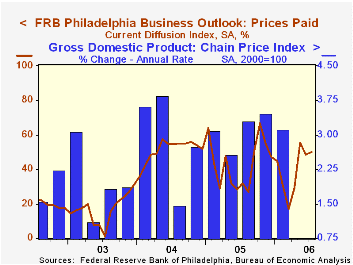
The prices paid index rose moderately. During the last ten years there has been a 76% correlation between the prices paid index and the three month growth in the intermediate goods PPI. There has been an 85% correlation with the change in core intermediate goods prices.
The separate index of expected business conditions in six months about doubled m/m in July but at 15.4 remained below the 2Q average. Expectations for employment fell m/m and the index also was below the 2Q average.
The latest Business Outlook survey from the Philadelphia Federal Reserve Bank can be found here.
The minutes to the latest Federal Open Market Committee meeting can be found here.
| Philadelphia Fed Business Outlook | July | June | July '05 | 2005 | 2004 | 2003 |
|---|---|---|---|---|---|---|
| General Activity Index | 6.0 | 13.1 | 9.6 | 12.4 | 28.0 | 10.5 |
| Prices Paid Index | 50.3 | 48.7 | 31.8 | 43.5 | 51.2 | 16.8 |
by Tom Moeller July 20, 2006
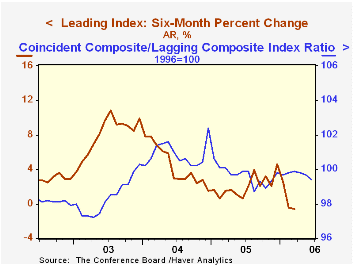
The Conference Board reported that the composite index of leading economic indicators ticked up 0.1% in June, the first increase in three months, and followed an unrevised 0.6% decline the prior month. Consensus expectations had been for a 0.2% increase.
Six month growth in the leaders fell to -0.6%, its weakest since early 2001. During the last ten years there has been a 43% correlation between the six-month change in the leading indicators and quarterly growth in real GDP.
The breadth of one month gain amongst the 10 components of the leading index improved sharply to 65% in June but over a six month span only 50% of the index components rose, the weakest breadth of six month gain since early 2005. In June, positive contributions from the money supply, consumer expectations, hours worked & jobless claims were offset by lower stock prices, vendor performance and building permits .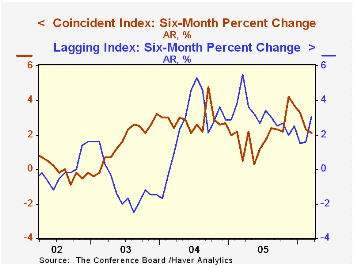
The method of calculating the contribution to the leading index from the spread between 10 year Treasury securities and the Fed funds rate has been revised. A negative contribution will now occur only when the spread inverts rather than when declining as in the past. More details can be found here.
The leading index is based on eight previously reported economic data series. Two series, orders for consumer goods and orders for capital goods, are estimated.
The coincident indicators rose 0.2% and during the last one & six months all of the coincident series rose. Over the last ten years there has been a 69% correlation between the change in the coincident indicators and real GDP growth.
The lagging indicators jumped 0.6%. During June nearly all of the series' components rose but during the last six months 42.9% rose. The ratio of coincident to lagging indicators, a measure of actual economic performance versus excess, fell for the third consecutive month.
Visit the Conference Board's site for coverage of leading indicator series from around the world.
| Business Cycle Indicators | June | May | 6 Month Chg., AR | 2005 | 2004 | 2003 |
|---|---|---|---|---|---|---|
| Leading | 0.1% | -0.6% | -0.6% | 2.3% | 7.4% | 5.0% |
| Coincident | 0.2% | 0.1% | 2.1% | 2.2% | 2.5% | 0.4% |
| Lagging | 0.6% | 0.2% | 3.1% | 3.5% | 0.0% | -0.0% |
by Tom Moeller July 20, 2006
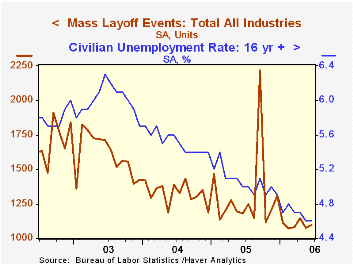
The number of mass layoff events rose 2.1% during June. Though the number remained down sharply from last year, for all of 2Q the number of events rose 1.6% from 1Q 2006, the first q/q increase in nearly two years.
During the last ten years there has been a (negative) 85% correlation between the three month average level of layoff announcements and the y/y change in payroll employment.
The number of persons affected in June by mass layoffs jumped 8.9% and rose 2.8% during 2Q. Layoffs in the transportation equipment sector (+29.0% y/y) dominated the rise in June and more than doubled m/m. Less transportation, the number of affected persons rose 1.6% (-10.6% y/y).
Increased layoffs in the apparel (69.8% y/y), machinery (35.1% y/y), furniture (153.0% y/y), textile mill, computer, metals and chemicals industries were damped by declines in electrical equipment (-76.0% y/y) and wholesale trade (-55.9% y/y).
The Mass Layoff Statistics (MLS) program collects reports on mass layoff actions that result in workers being separated from their jobs. Monthly mass layoff numbers are from establishments which have at least 50 initial claims for unemployment insurance (UI) filed against them during a 5-week period.
| Mass Layoffs | June | May | Y/Y | 2005 | 2004 | 2003 |
|---|---|---|---|---|---|---|
| All US Industries (# Events, SA) | 1,097 | 1,074 | -7.3% | 15,699 | 15,926 | 19,220 |
| Total (# Persons, SA) | 119,662 | 109,858 | -6.8% | 1,722,452 | 1,591,081 | 1,946,548 |
by Tom Moeller July 20, 2006
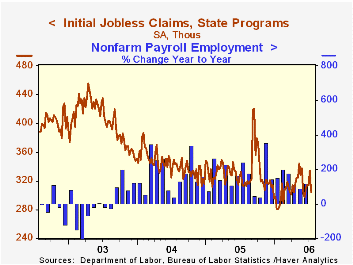
Initial claims for unemployment insurance fell 30,000 to 304,000 last week after an upwardly revised 20,000 increase during the prior week. Consensus expectations had been for a lesser decline to 320,000 claims.
The figure covers the survey period for July nonfarm payrolls and initial claims were down 5,000 (-1.6%) from the June period. During the last ten years there has been a (negative) 78% correlation between the level of initial claims and the m/m change in nonfarm payroll employment. 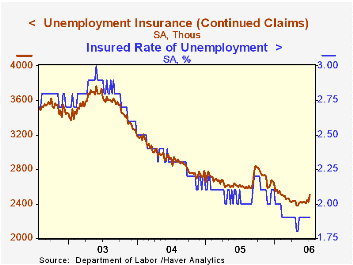
The w/w decline reversed all of the increases during the prior four weeks and dropped claims to the lowest level in one month. The four-week moving average of initial claims fell to 316,750 (-1.6% y/y).
Continuing claims for unemployment insurance jumped 85,000 following a deepened 28,000 decline the previous week. Claims were at the highest level since February.
The insured rate of unemployment held steady at 1.9% where it has been since February.
Robust estimation and monetary policy with unobserved structural change from the Federal Reserve Bank of San Francisco is available here
| Unemployment Insurance (000s) | 07/15/06 | 07/08/06 | Y/Y | 2005 | 2004 | 2003 |
|---|---|---|---|---|---|---|
| Initial Claims | 304 | 334 | -3.5% | 332 | 343 | 403 |
| Continuing Claims | -- | 2,505 | -3.5% | 2,663 | 2,923 | 3,530 |
by Carol Stone July 20, 2006
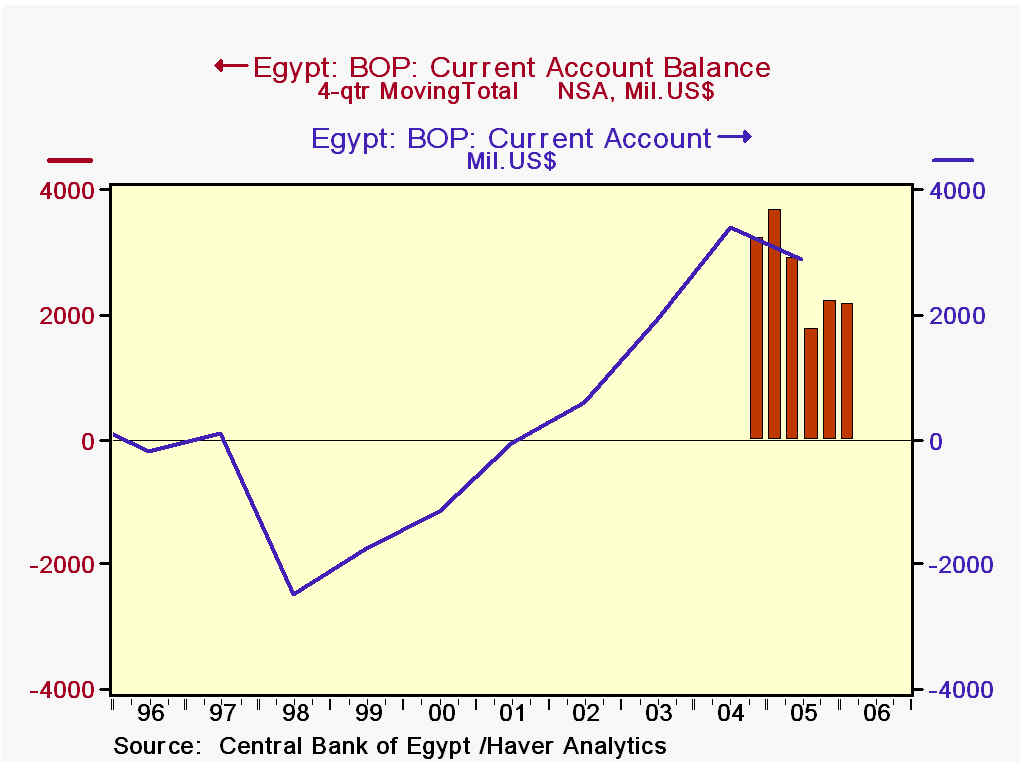
The Central Bank of Egypt today reported its balance of payments array for Q1 2006. The current account surplus increased to $934 million from $801 million in Q4 2005, although it was a bit smaller than Q1 2005 at $995 billion. For 2005 as a whole, Egypt had a current account surplus of $2.2 billion.
These numbers are small in absolute size. For instance, the balance on services in the US was $66.0 billion last year, nearly 9 times larger than Egypt's $7.6 billion. But some aspects of these Egyptian figures are quite fascinating and bear examination.
First, the current account itself shows a surplus. One frequently presumes that emerging market countries run perennial deficits and struggle constantly with debt and debt service issues. But presently, that situation is improving for Egypt. Its current account turned a surplus in its fiscal year 2002 (ended June 30, 2002) and has also achieved that every quarter since the quarterly data began in early 2004.
To be sure, the goods accounts are in deficit, which totaled $11.1 billion in calendar 2005 and continued with a $2.2 billion shortfall in Q1 2006. But Egypt has some oil and, as seen in the table below, is benefiting from the high prices with an increasing surplus in petroleum. This, of course, limits the overall deficit in goods.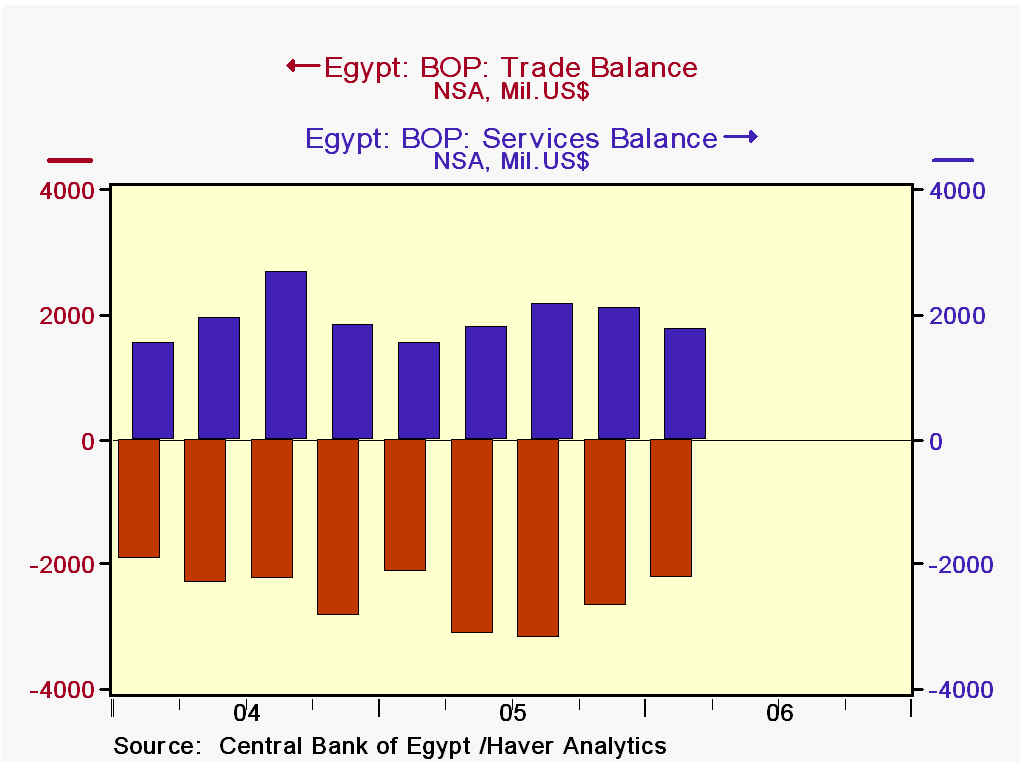
The services accounts are important for Egypt. It collected nearly $3.5 billion last year in tolls from the Suez Canal, a strategic and lucrative asset for that nation. Egypt is able, too, to benefit from its ancient history as a tourist attraction, bringing a net of more than $5 billion to the country last year in travel accounts.
Lastly among the current accounts, the country receives substantial amounts of transfers. We in the US look at our transfer item as a drain, but sizable amounts of income go to Egypt, apparently from individuals working abroad. Total net transfers were $5.7 billion in 2005, with the portion from private sources amounting to almost exactly $5.0 billion.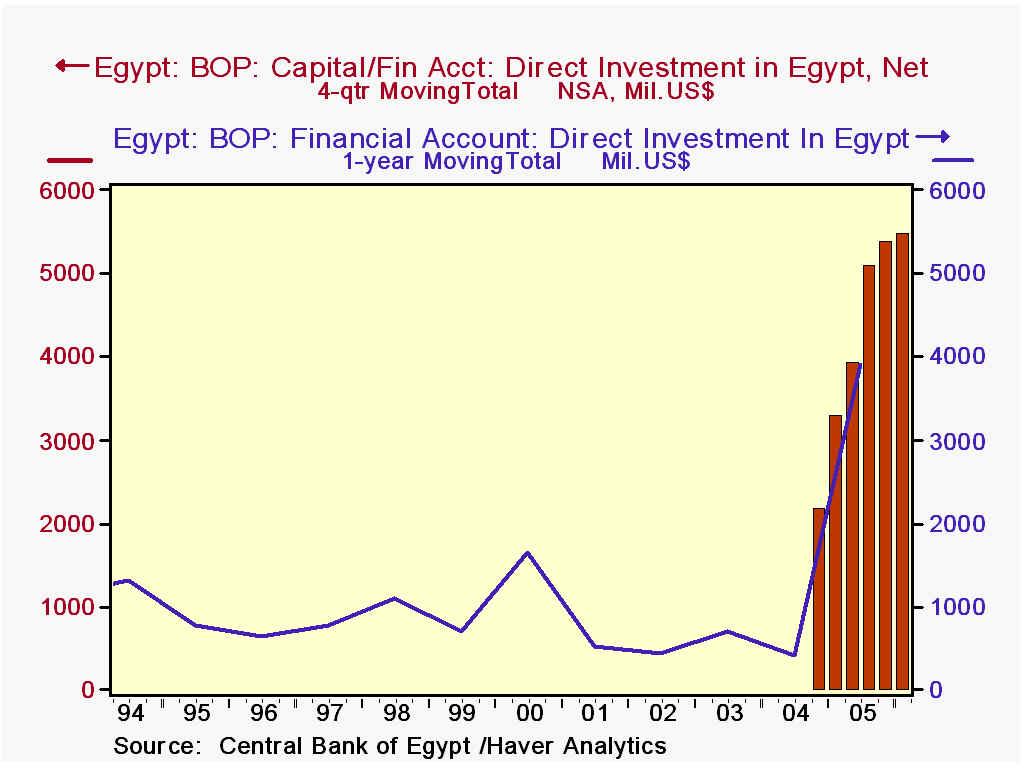
On the capital and financial account side, the most outstanding item is the recent huge increase in direct investment in Egypt. As seen below, capital inflows for investment projects more than doubled in 2005 to $5.3 billion from $2.0 billion in 2004. The Q1 amount continues the 2005 pace. Information from news sources indicates that these funds cover a wide variety of activities, including manufacturing and the rapidly growing tourism sector. Recently announced projects include a major expansion of port facilities at Suez, so these flows are likely to remain sizable for a considerable period. At the same time, bank lending patterns indicate a persistent net outflow of capital from that sector.
All told, Egypt's balance of payments accounts are running a positive overall balance, as services, transfers and some capital accounts more than offset a deficit on goods trade. As a result, Egypt's reserves are increasing, in Q1 by $713 million, following a substantial $6.3 billion in 2005.
| Egypt: Mil. US$ | Q1 2006 | Q4 2005 | Q3 2005 | Q1 2005 | 2005 | 2004 |
|---|---|---|---|---|---|---|
| Current Account | 934 | 801 | 327 | 995 | 2,207 | 3,236 |
| Balance on Goods | -2,222 | -2,663 | -1,028 | -2,128 | -11,127 | -9,312 |
| Petroleum | 1,518 | 1,188 | 985 | 638 | 2,562 | 1,730 |
| Balance on Services | 1,780 | 2,074 | 2,170 | 1,530 | 7,586 | 7,982 |
| Suez Canal | 862 | 891 | 871 | 847 | 3,467 | 3,076 |
| Travel (Net) | 1,257 | 1,200 | 1,928 | 994 | 5,222 | 4,868 |
| Net Transfers | 1,376 | 1,390 | 1,355 | 1,593 | 5,748 | 4,567 |
| Net Direct Investment | 1,296 | 1,320 | 1,928 | 1,214 | 5,284 | 1,998 |
| Change in Reserves | 713 | 740 | 1,812 | 2,538 | 6,316 | 680 |

Tom Moeller
AuthorMore in Author Profile »Prior to joining Haver Analytics in 2000, Mr. Moeller worked as the Economist at Chancellor Capital Management from 1985 to 1999. There, he developed comprehensive economic forecasts and interpreted economic data for equity and fixed income portfolio managers. Also at Chancellor, Mr. Moeller worked as an equity analyst and was responsible for researching and rating companies in the economically sensitive automobile and housing industries for investment in Chancellor’s equity portfolio. Prior to joining Chancellor, Mr. Moeller was an Economist at Citibank from 1979 to 1984. He also analyzed pricing behavior in the metals industry for the Council on Wage and Price Stability in Washington, D.C. In 1999, Mr. Moeller received the award for most accurate forecast from the Forecasters' Club of New York. From 1990 to 1992 he was President of the New York Association for Business Economists. Mr. Moeller earned an M.B.A. in Finance from Fordham University, where he graduated in 1987. He holds a Bachelor of Arts in Economics from George Washington University.
More Economy in Brief


