 Global| Oct 20 2005
Philadelphia Fed Activity Index Recovered
by:Tom Moeller
|in:Economy in Brief
Summary
The October Index of General Business Conditions in the manufacturing sector from the Philadelphia Fed recovered just about all of the prior month's loss. A surge to 17.3 from 2.2 in September compared to Consensus expectations for a [...]
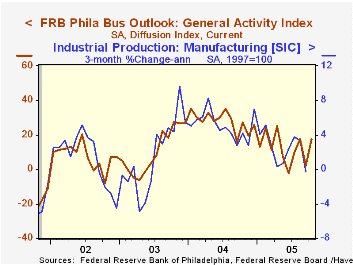
The October Index of General Business Conditions in the manufacturing sector from the Philadelphia Fed recovered just about all of the prior month's loss. A surge to 17.3 from 2.2 in September compared to Consensus expectations for a lesser gain to 10.0.
During the last ten years there has been a 68% correlation between the level of the Philadelphia Fed Business Conditions Index and three month growth in factory sector industrial production. There has been a 50% correlation with q/q growth in real GDP.
The sub index measuring new orders led the improvement and rose to 18.6 from -0.5 while the shipments index improved moderately to 19.5 from 13.2. The index covering the number of employees surged to 17.0 and landed at the highest level since January. During the last ten years there has been a 64% correlation between the employment index and the three month growth in factory payrolls.
The business conditions index reflects a separate survey question, not the sub indexes.
The separate index of expected business conditions in six months recovered more than half of the prior month's decline and rose to 22.0.
The prices paid index jumped to the highest level since January. During the last ten years there has been a 75% correlation between the prices paid index and the three month growth in the intermediate goods PPI. The correlation with the finished goods PPI has been 50% and with the CPI it's been 43%.
The Philadelphia Fed index is based on a survey of 250 regional manufacturing firms, but these firms sell nationally and internationally.
The latest Business Outlook survey from the Philadelphia Federal Reserve Bank can be found here.
| Philadelphia Fed Business Outlook | Oct | Sept | Oct '04 | 2004 | 2003 | 2002 |
|---|---|---|---|---|---|---|
| General Activity Index | 17.3 | 2.2 | 27.2 | 28.1 | 10.6 | 7.7 |
by Tom Moeller October 20, 2005
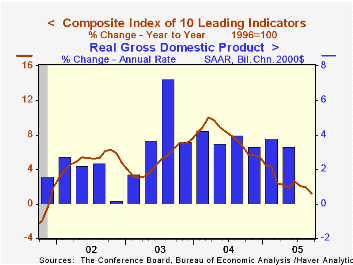
The Composite Index of Leading Economic Indicators reported by the Conference Board fell 0.7% in September following declines of 0.1% during the prior two months. The initial effects of the Gulf hurricanes as well as earlier weakening amongst the leaders' components left the index's six-month growth at a low 0.9%. Consensus expectations had been for a 0.5% September decline.
The breadth of one month gain amongst the 10 components of the leading index fell to 45%, down from a high of 85% during June. Higher claims for unemployment insurance and lower consumer expectations had the largest negative effects on the leader's one month change.
The method of calculating the contribution to the index from the interest rate yield spread has been revised. A negative contribution will now occur only when the spread inverts rather than when declining as in the past. More details can be found here.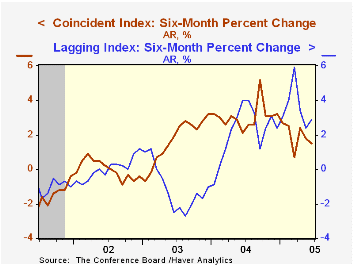
The leading index is based on eight previously reported economic data series. Two series, orders for consumer goods and orders for capital goods, are estimated.
The coincident indicators fell 0.1% following a downwardly revised 0.1% decline during August. The decline was due mostly to lower industrial output in September although over the prior six months, all of the component series were up.
The lagging indicators rose 0.2% with much of the rise due to a longer average duration of unemployment. The ratio of coincident to lagging indicators, a measure of actual economic performance versus excess, fell to its lowest level since late 2003.
Visit the Conference Board's site for coverage of leading indicator series from around the world.
| Business Cycle Indicators | Sept | Aug | 6 Month Chg., AR | 2004 | 2003 | 2002 |
|---|---|---|---|---|---|---|
| Leading | -0.7% | -0.1% | 0.9% | 7.7% | 5.1% | 5.0% |
| Coincident | -0.1% | -0.1% | 1.5% | 2.7% | 0.4% | -0.6% |
| Lagging | 0.2% | 0.0% | 2.9% | -0.1% | -0.1% | -0.7% |
by Tom Moeller October 20, 2005
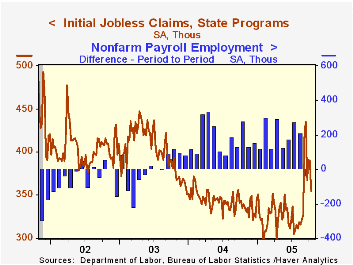
Initial claims for unemployment insurance dropped 35,000 to 355,000 last week versus a little revised level of 389,000 during the prior period. Consensus expectations had been for 370,000 claims.
The Labor Department indicated that 40,000 initial claims last week were linked to Hurricanes Katrina & Rita.
The latest figure covers the survey period for October nonfarm payrolls and initial claims fell 80,000 (18.4%) from the September period.
The four-week moving average of initial claims fell to 376,000 (+9.3% y/y) from 396,000 during the prior four weeks.
Continuing claims for unemployment insurance rose 35,000 following a deepened 12,000 worker decline during the prior week.
The insured rate of unemployment rose to 2.3% from 2.2% during the prior three weeks. The low in early September was 2.0%.
The latest Beige Book covering US regional economic conditions from the Federal Reserve Board can be found here.
Remarks by Fed Governor Donald L. Kohn titled The Economic Outlook are available here.
| Unemployment Insurance (000s) | 10/15/05 | 10/08/05 | Y/Y | 2004 | 2003 | 2002 |
|---|---|---|---|---|---|---|
| Initial Claims | 355 | 389 | 6.0% | 343 | 402 | 404 |
| Hurricane Related Claims (000, NSA) | 40 | 75 | ||||
| Continuing Claims | -- | 2,370 | 3.4% | 2,926 | 3,531 | 3,570 |
by Carol Stone October 20, 2005
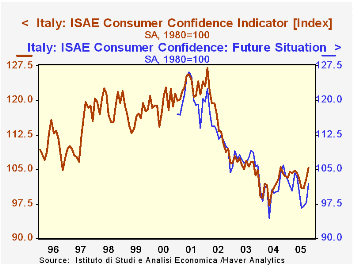
Italian consumer confidence improved noticeably for October, but people also have a more uncertain inflation outlook. The overall confidence index, calculated by ISAE, the Institute for Studies and Economic Analysis, rose 2.4 points from September to 105.3, the highest in a year. Components covering sentiment about the "general" situation and the "future" situation were both up, by 3 and 4 points, respectively, in the month.
At the same time, several details of the survey appear more mixed than the broad indexes might suggest. Household finances are viewed modestly worse: the "household financial situation", expressed as a favorable/unfavorable balance, is reported at -50 following -48 in September and -44 a year ago. Household budget conditions stand at +5, compared with +8 both a month and a year ago. However, financial expectations are marginally better, at -7 in October from -10 in September but -6 in October 2004. These mixed results imply that consumers are fairly unsure of their finances, but the small size of the moves indicate only hints of nervousness, not decisive moodswings.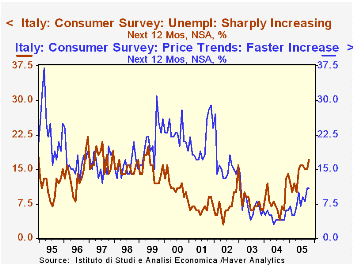
Expectations on inflation have changed more, perhaps driven by energy prices. The portion of consumers looking for prices to remain stable has fallen sharply in recent months, as seen in the table below: October's reading is 41% from 58% in October 2004. Offsets occurred in the groups looking for "large" increases, to 11% from 4%, and "medium" increases, to 21% from 15%. The number "unsure" of what they believe about inflation moved to 8% from 4%.
Consumers' nervousness over their finances and relative uncertainty over inflation are accompanied by a more distinct deterioration in the unemployment outlook. 17% of respondents expect unemployment to rise "sharply" in the coming year, up from just 6% a year ago. Those looking for a "slight" increase ticked down one percentage point to 33% from 34%. Thus, those anticipating that unemployment will go up now constitute exactly half of the survey, from 40% last October. So some parts of this consumer survey may indicate that people are in better moods, but other aspects suggest developing worry and uncertainty over the two major bugaboos in any economy: inflation and unemployment.
| Italy ISAE Survey | Oct 2005 | Sept 2005 | Aug 2005 | Oct 2004 | 2004 | 2003 | 2002 |
|---|---|---|---|---|---|---|---|
| Overall Consumer Confidence, Index 1980 = 100, Seasonally Adjusted | 105.3 | 102.9 | 100.9 | 101.1 | 101.4 | 106.2 | 115.8 |
| General Situation | 83.8 | 80.8 | 80.2 | 94.6 | 88.6 | 91.4 | 105.2 |
| Future Situation | 101.8 | 97.8 | 97.0 | 104.3 | 100.8 | 107.2 | 113.4 |
| Prices, Next 12 Mos: % Expecting Large Increase, Not Seasonally Adjusted | 11 | 11 | 8 | 4 | 5 | 7 | 16 |
| Medium Increase | 21 | 19 | 16 | 15 | 14 | 15 | 35 |
| Smaller Increase | 17 | 16 | 14 | 17 | 21 | 20 | 13 |
| Stable | 41 | 45 | 52 | 58 | 54 | 51 | 31 |

Tom Moeller
AuthorMore in Author Profile »Prior to joining Haver Analytics in 2000, Mr. Moeller worked as the Economist at Chancellor Capital Management from 1985 to 1999. There, he developed comprehensive economic forecasts and interpreted economic data for equity and fixed income portfolio managers. Also at Chancellor, Mr. Moeller worked as an equity analyst and was responsible for researching and rating companies in the economically sensitive automobile and housing industries for investment in Chancellor’s equity portfolio. Prior to joining Chancellor, Mr. Moeller was an Economist at Citibank from 1979 to 1984. He also analyzed pricing behavior in the metals industry for the Council on Wage and Price Stability in Washington, D.C. In 1999, Mr. Moeller received the award for most accurate forecast from the Forecasters' Club of New York. From 1990 to 1992 he was President of the New York Association for Business Economists. Mr. Moeller earned an M.B.A. in Finance from Fordham University, where he graduated in 1987. He holds a Bachelor of Arts in Economics from George Washington University.
More Economy in Brief


