 Global| Aug 21 2006
Oil & Gold Prices Down. A Trend Reversal?
by:Tom Moeller
|in:Economy in Brief
Summary
Inflationary concerns were piqued by the up-trend in prices for gold & oil. That trend reversed a bit last week as the price of West Texas Intermediate Crude Oil settled on Friday at $71.15 per barrel, down 7.6% from the near-high of [...]
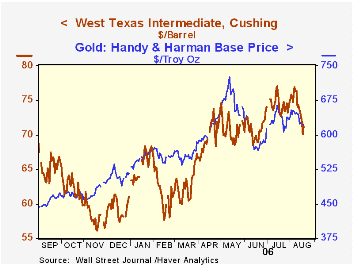
Inflationary concerns were piqued by the up-trend in prices for gold & oil. That trend reversed a bit last week as the price of West Texas Intermediate Crude Oil settled on Friday at $71.15 per barrel, down 7.6% from the near-high of $76.99 reached early the prior week. Gold prices also moved lower to $613.90, off 7.5% from the July high.
Evidence that higher oil prices forced cutbacks in the demand for gasoline as well as some diminution of political tensions could have caused the trend reversal. In fact, the latest monthly figures on real personal consumption expenditures indicate demand for gasoline & oil fell 5.5% from the peak during January of 2005.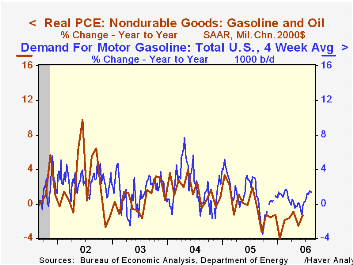
These gasoline demand figures through June were roughly consistent with the Department of Energy's estimates of lower demand, but during July & August consumers seem to have grown accustomed to higher prices. Gasoline demand versus last year returned to the plus column.
The four week average of gasoline demand through mid-August rose 1.3% versus last year as a result of firm demand this Summer. Certainly that growth is well off the 4-8% rates of early 2004, but consumers' resilience clearly is in evidence.
The just released figures from the Federal Highway Administration indicated that through 2004, the miles driven in the U.S. by passenger cars grew a steady 2.0% from the year earlier. These figures are available in Haver's USECON database under Highway Statistics.
The latest Short-Term Energy and Summer Fuels Outlook from the U.S. Energy Information Administration can be found here.
| US Weekly | 08/15/06 | 12/31/05 | Y/Y | 2005 | 2004 | 2003 |
|---|---|---|---|---|---|---|
| Light Sweet Crude Oil, WTI (per BBL.) | $73.06 | $58.16 | 10.5% | $57.59 | $41.78 | $32.781 |
| Cash Gold Price, Handy & Harmon | $625.50 | $507.40 | 41.2% | $447.13 | $411.72 | $367.78 |
by Louise Curley August 21, 2006
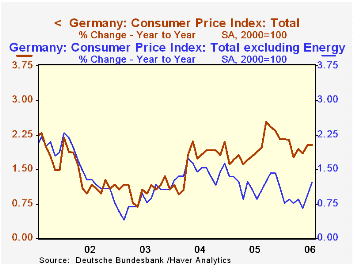
Inflation in Germany has largely been the result of rising energy costs as can be seen in the first chart which shows the total index of inflation and the core index excluding energy. The widening difference between the two series is due to the rising price of oil. So far there has been little evidence that the rise in energy prices has had secondary effects on the economy. In this connection, one series to watch is that of the monthly data on German hourly wages for the whole economy that was announced today.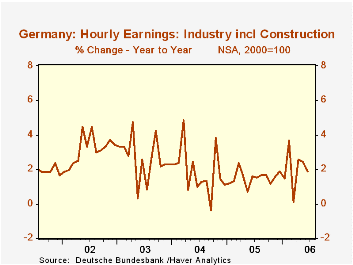
Although the index declined 0.29% in June to 102.1 from 102.4 in May, it was 0.99% above June of 2005. Since the data are not seasonally adjusted, the year to year comparison is the more meaningful.While it is volatile, the second chart shows that wage growth is beginning to accelerate reversing the downward trend started in 2003. The annual increase in hourly wages was 2.68% in 2002, 2.03% in 2003, 1.17% in 2004 and 0.97% in 2005. For the first six months of this year, hourly wages have averaged an increase of 1.2% over the first six months of last year. With declines in the unemployment rate, union demands are likely to rise. Last week, IG Metall, the German steel and metalworkers' union demanded a 7% pay rise for the steel industry. While such demands are likely to be moderated, it appears that the secondary effects of the rise in oil prices are beginning to be felt.
| Germany | Jun 06 | May 06 | Jun 05 | M/M % | Y/Y % | 2005 | 2004 | 2003 |
|---|---|---|---|---|---|---|---|---|
| Consumer Price Index (2000=100) | 110.3 | 110.0 | 108.1 | 0.29 | 2.04 | 108.3 | 105.5 | 104.0 |
| Core Index, Total ex Energy | 107.6 | 107.4 | 106.6 | 0.19 | 0.94 | 106.7 | 105.5 | 104.0 |
| Hourly Wages (NSA, 2000=100) | 102.79 | 105.25 | 104.86 | -1.40 | -1.97 | 105.41 | 144.40 | 100.30 |
| Annual % Change | -- | -- | -- | -- | -- | 1.51 | 1.81 | 2.52 |

Tom Moeller
AuthorMore in Author Profile »Prior to joining Haver Analytics in 2000, Mr. Moeller worked as the Economist at Chancellor Capital Management from 1985 to 1999. There, he developed comprehensive economic forecasts and interpreted economic data for equity and fixed income portfolio managers. Also at Chancellor, Mr. Moeller worked as an equity analyst and was responsible for researching and rating companies in the economically sensitive automobile and housing industries for investment in Chancellor’s equity portfolio. Prior to joining Chancellor, Mr. Moeller was an Economist at Citibank from 1979 to 1984. He also analyzed pricing behavior in the metals industry for the Council on Wage and Price Stability in Washington, D.C. In 1999, Mr. Moeller received the award for most accurate forecast from the Forecasters' Club of New York. From 1990 to 1992 he was President of the New York Association for Business Economists. Mr. Moeller earned an M.B.A. in Finance from Fordham University, where he graduated in 1987. He holds a Bachelor of Arts in Economics from George Washington University.
More Economy in Brief


