 Global| Dec 06 2002
Nonfarm Payrolls Fell Unexpectedly
by:Tom Moeller
|in:Economy in Brief
Summary
Nonfarm payrolls were weaker than expected last month, falling 40,000 instead of rising 30,000 as expected by Consensus estimates. Figures for October and September were revised up slightly due to slightly higher estimates of service [...]
Nonfarm payrolls were weaker than expected last month, falling 40,000 instead of rising 30,000 as expected by Consensus estimates. Figures for October and September were revised up slightly due to slightly higher estimates of service sector (mostly government) employment.
The unemployment rate rose by more than expected. Employment fell a whopping 689,000 (0.1% YTD) following a large decline in October. The labor force fell 390,000 (0.3% YTD).
Amongst industries, factory sector jobs fell 45,000 (-3.0% YTD) following a downwardly revised October decline. The one-month diffusion index for the factory sector improved slightly to 41.5 but remained low enough to suggest further declines in manufacturing sector jobs. Construction jobs fell 4,000(-1.4% YTD). Jobs in service producing industries rose 11,000 (0.6% YTD). Government employment rose 8,000 (1.1% YTD).
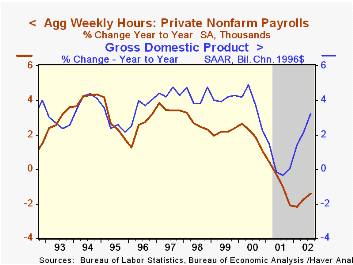
The length of the workweek was unchanged last month but up slightly from the 3Q average. The index of aggregate hours worked (employment times hours worked) fell 0.1% following an upwardly revised 0.1% October decline. So far the 4Q average is 0.2% above 3Q. That followed a 0.2% 3Q decline.
Over the last ten years there has been a 52% correlation between the quarterly change in aggregate hours worked and real GDP. That correlation is down from 89% in the 1980s. The decline is due to the recent acceleration in productivity growth.
The one-month diffusion index for nonfarm payrolls rose slightly to 47.7 from a downwardly revised October level of 46.8. The three month diffusion index rose to 45.5. These levels suggest little or no employment growth near term.
The gain in average hourly earnings (2.5% YTD) was as expected and October's gain was revised slightly higher.
The nonfarm payroll employment figures are based on reports provided to the US Labor Department by businesses, while the figures from which the unemployment rate is derived are based on a survey of US households.
| Employment | Nov | Oct | Y/Y | 2001 | 2000 | 1999 |
|---|---|---|---|---|---|---|
| Payroll Employment | -40,000 | 6,000 | -0.2% | 0.2% | 2.2% | 2.4% |
| Manufacturing | -45,000 | -59,000 | -3.5% | -4.2% | -0.4% | -1.3% |
| Average Weekly Hours | 34.2 | 34.2 | 34.1 | 34.2 | 34.4 | 34.5 |
| Average Hourly Earnings | 0.3% | 0.3% | 2.9% | 4.1% | 3.9% | 3.6% |
| Unemployment Rate | 6.0% | 5.7% | 5.6% | 4.8% | 4.0% | 4.2% |
by Tom Moeller December 6, 2002
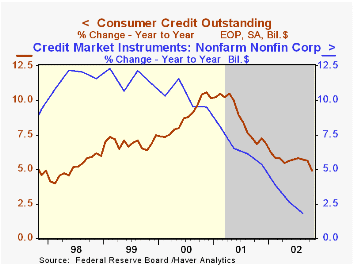
Consumer credit outstanding rose only $1.5B (0.1%) in October. Consensus expectations were for a $6.5B rise. August and September figures were revised down. So far this year, consumer credit outstanding has risen at a 4.0% annual rate.
Revolving credit rose only 0.3%, the same as in September which was revised down from a 0.8% gain. Revolving credit growth was 4.1% (AR) through October.
Nonrevolving credit fell slightly in October, the second decline in three months. Nonrevolving extension was up 4.0% (AR) YTD.
Yesterday's Federal Reserve release of third quarter Flow of Funds indicated that credit market debt owed by the household sector grew at a 10.4% annual rate last quarter (9.2% y/y) while debt outstanding of the nonfinancial business sector fell (1.8% y/y).
According to the Flow of Funds figures, consumer credit liabilities grew at a 4.9% (5.5% y/y) rate last quarter while mortgage debt grew at a 13.9% (11.5% y/y) rate.
| Consumer Credit Outstanding | Oct m/m | Sept m/m | Y/Y | 2001 | 2000 | 1999 |
|---|---|---|---|---|---|---|
| Total | $1.5B | $4.7B | 4.9% | 6.9% | 10.2% | 7.5% |
| Revolving | $2.4B | $1.8B | 3.7% | 5.0% | 11.5% | 6.3% |
| Nonrevolving | $-1.0B | $3.0B | 5.8% | 8.3% | 9.2% | 8.4% |

Tom Moeller
AuthorMore in Author Profile »Prior to joining Haver Analytics in 2000, Mr. Moeller worked as the Economist at Chancellor Capital Management from 1985 to 1999. There, he developed comprehensive economic forecasts and interpreted economic data for equity and fixed income portfolio managers. Also at Chancellor, Mr. Moeller worked as an equity analyst and was responsible for researching and rating companies in the economically sensitive automobile and housing industries for investment in Chancellor’s equity portfolio. Prior to joining Chancellor, Mr. Moeller was an Economist at Citibank from 1979 to 1984. He also analyzed pricing behavior in the metals industry for the Council on Wage and Price Stability in Washington, D.C. In 1999, Mr. Moeller received the award for most accurate forecast from the Forecasters' Club of New York. From 1990 to 1992 he was President of the New York Association for Business Economists. Mr. Moeller earned an M.B.A. in Finance from Fordham University, where he graduated in 1987. He holds a Bachelor of Arts in Economics from George Washington University.
More Economy in Brief


