 Global| Jan 10 2003
Nonfarm Payrolls Again Fell Unexpectedly
by:Tom Moeller
|in:Economy in Brief
Summary
Nonfarm payrolls were quite weak last month, falling 101,000 instead of rising 20,000 as expected by Consensus estimates. The decline in November payrolls was about doubled (mostly due to lowered private services) but figures for [...]
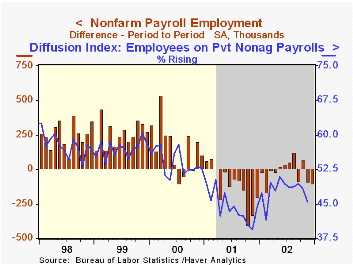
Nonfarm payrolls were quite weak last month, falling 101,000 instead of rising 20,000 as expected by Consensus estimates. The decline in November payrolls was about doubled (mostly due to lowered private services) but figures for October were revised up.
Last month's decline in payrolls was the third in four months, rounding out the weakest year for the US job market since 1991.
The one-month diffusion index for nonfarm payrolls was hardly changed at 45.5. November's level was revised down. The three month diffusion index fell to 42.8. These indices are leading indicators and suggest negative employment growth near term.
As expected, the unemployment rate held its high level of the month prior. Employment fell 273,000 (-0.1% y/y), the third consecutive large decline. The labor force fell 191,000 (0.2% y/y), also the third consecutive decline.
Amongst industries the number of factory sector jobs continued down, falling 65,000 (-3.5% y/y). It was the largest monthly percentage decline (0.4%) in manufacturing jobs since February. The one-month diffusion index for the factory sector dropped to 37.5, its lowest level since February and suggested further declines in factory sector jobs. Construction jobs rose a slight 3,000 (-1.4% y/y) following two months of decline. Jobs in service producing industries rose 42,000 (0.5% y/y), the second consecutive decline. Government employment rose 14,000 (1.2% y/y).
The length of the workweek fell slightly last month. For the quarter the workweek was up slightly versus 3Q. The index of aggregate hours worked (employment times hours worked) fell to the lowest level since July. The 4Q average was unchanged from 3Q.
Over the last ten years there has been a 53% correlation between the quarterly change in aggregate hours worked and real GDP. That correlation is down from 89% in the 1980s. The decline is due to the recent acceleration in productivity growth.
The 0.3% gain in average hourly earnings was as expected.
The nonfarm payroll employment figures are based on reports provided to the US Labor Department by businesses, while the figures from which the unemployment rate is derived are based on a survey of US households.
| Employment | Dec | Nov | Y/Y | 2002 | 2001 | 2000 |
|---|---|---|---|---|---|---|
| Payroll Employment | -101,000 | -88,000 | -0.1% | -0.9% | 0.2% | 2.2% |
| Manufacturing | -65,000 | -57,000 | -3.5% | -5.5% | -4.2% | -0.4% |
| Average Weekly Hours | 34.1 | 34.2 | 34.1 | 34.2 | 34.2 | 34.4 |
| Average Hourly Earnings | 0.3% | 0.2% | 3.0% | 3.2% | 4.0% | 3.8% |
| Unemployment Rate | 6.0% | 6.0% | 5.8% | 5.8% | 4.8% | 4.0% |
by Tom Moeller January 10, 2003
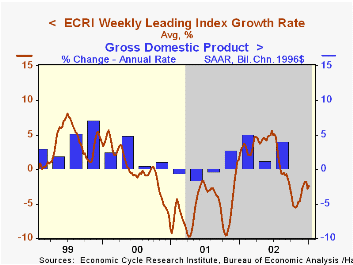
The Weekly Leading Index of the US economy published by the Economic Cycle Research Institute (ECRI) rose sharply in the opening week of 2003.
The level of the leading index added to a slight gain in December. In November, the index rose meaningfully from the October low. Despite these gains, the six-month growth rate of the index remained negative at -2.4%.
Construction of the ECRI Leading Index differs from the Index of Leading Economic Indicators published by the Conference Board. Nevertheless there has been an 80% correlation between the annual percent change in the two over the last 20 years.
The components of the index are money supply plus stock & bond mutual funds, the JOC-ECRI industrial materials price index, mortgage applications, bond quality spreads, stock prices, bond yields, and initial jobless insurance claims.
The median lead of the ECRI index at business cycle peaks has been 10.5 months and at cycle troughs 3.0 months. The sideways movement of the leading index in 2002 may or may not signal something about the economy's growth rate.
For more on ECRI and the Weekly Leading Index click here.
| ECRI | Dec | Nov | Y/Y | 2002 | 2001 | 2000 |
|---|---|---|---|---|---|---|
| Leading Index | 118.2 | 118.1 | -1.1% | 0.9% | -5.2% | 1.0% |

Tom Moeller
AuthorMore in Author Profile »Prior to joining Haver Analytics in 2000, Mr. Moeller worked as the Economist at Chancellor Capital Management from 1985 to 1999. There, he developed comprehensive economic forecasts and interpreted economic data for equity and fixed income portfolio managers. Also at Chancellor, Mr. Moeller worked as an equity analyst and was responsible for researching and rating companies in the economically sensitive automobile and housing industries for investment in Chancellor’s equity portfolio. Prior to joining Chancellor, Mr. Moeller was an Economist at Citibank from 1979 to 1984. He also analyzed pricing behavior in the metals industry for the Council on Wage and Price Stability in Washington, D.C. In 1999, Mr. Moeller received the award for most accurate forecast from the Forecasters' Club of New York. From 1990 to 1992 he was President of the New York Association for Business Economists. Mr. Moeller earned an M.B.A. in Finance from Fordham University, where he graduated in 1987. He holds a Bachelor of Arts in Economics from George Washington University.
More Economy in Brief


