 Global| Mar 24 2006
New Home Sales Fall 10.5% in February; Inventories Rose and Prices Declined
Summary
New home sales fell 10.5% in February, the largest one-month decline since February 1995. Sales were 1.08 million (SAAR), the lowest volume since March 2003. Following January's 5.3% drop, sales over the two months were down 15.3%, [...]
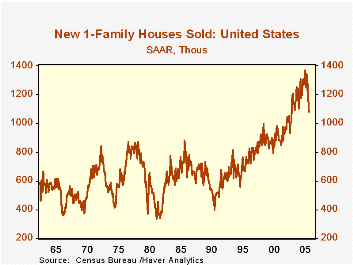
New home sales fell 10.5% in February, the largest one-month decline since February 1995. Sales were 1.08 million (SAAR), the lowest volume since March 2003. Following January's 5.3% drop, sales over the two months were down 15.3%, the largest two-month fall since February 1994.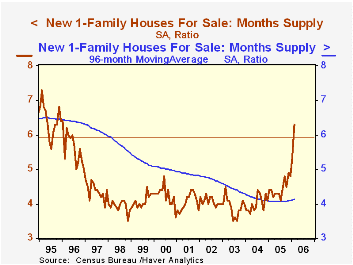
Builders have not yet caught up, of course, with the change in the sales pace, and inventories of unsold homes rose again last month, reaching 548,000. At February's sales rate, that equals a 6.3-month supply. Four months ago, this ratio was 4.5 months. This too marks a sharp turn.
How disturbing is this sudden downdraft in home sales? There are some mitigating factors. The sales drop was not nationwide. They actually rose in the northeast, 12.7%, and midwest, 5.2%. The jump in the inventory position, while large, serves mainly to highlight how very low stocks were the last several years. As seen in our graph, the long-run average supply is 5.9+ months (calculated on DLXVG3 by taking the 518-month moving average, that is, the full span of the data). 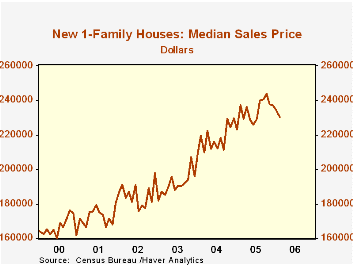 Also, the roundly 4-month average from 1998 to 2004 is (very) roughly the length of time it takes to build a house. So for that period at least, it seems that builders were selling homes just about as fast as they could produce them. Additionally, existing home sales, down in previous months, had a nice rebound in February, as documented here yesterday by Tom Moeller. So total housing demand did not fall in the month.
Finally, home prices are showing some signs of hesitation, with a fourth consecutive monthly decline in February. Part of this price measure relates to the geographic distribution of the sales; they fell most sharply in the West, one of the high-priced regions, while they grew in the Midwest, a lower-priced region, giving a downward bias to the national price measure. Prices are available by region only quarterly, so we cannot yet tell what is happening within each area.
| U.S. New Homes | Feb 2006 | Jan 2006 | Feb 2005 | 2005 | 2004 | 2003 |
|---|---|---|---|---|---|---|
| Total Sales (SAAR, Thous) | 1,080 | 1,207 | 1,247 | 1,280 | 1,200 | 1,091 |
| Inventory of Unsold Homes (SA, Thous) | 548 | 525 | 513 | 469 | 395 | 348 |
| Months' Supply (SA) | 6.3 | 5.3 | 4.4 | 4.5 | 4.0 | 3.9 |
| Median Price (NSA,$) | 230,400 | 234,200 | 237,800 | 234,058 | 217,817 | 191,385 |
Carol Stone, CBE
AuthorMore in Author Profile »Carol Stone, CBE came to Haver Analytics in 2003 following more than 35 years as a financial market economist at major Wall Street financial institutions, most especially Merrill Lynch and Nomura Securities. She had broad experience in analysis and forecasting of flow-of-funds accounts, the federal budget and Federal Reserve operations. At Nomura Securities, among other duties, she developed various indicator forecasting tools and edited a daily global publication produced in London and New York for readers in Tokyo. At Haver Analytics, Carol was a member of the Research Department, aiding database managers with research and documentation efforts, as well as posting commentary on select economic reports. In addition, she conducted Ways-of-the-World, a blog on economic issues for an Episcopal-Church-affiliated website, The Geranium Farm. During her career, Carol served as an officer of the Money Marketeers and the Downtown Economists Club. She had a PhD from NYU's Stern School of Business. She lived in Brooklyn, New York, and had a weekend home on Long Island.
More Economy in Brief


