 Global| Aug 24 2006
New Home Sales Down, Inventory Ballooned
by:Tom Moeller
|in:Economy in Brief
Summary
Sales of new single family home sales dropped 4.3% last month to 1.072M though a 0.9% June decline was revised shallower. Consensus expectations had been for July sales of 1.10M. New home sales during the first seven months of this [...]
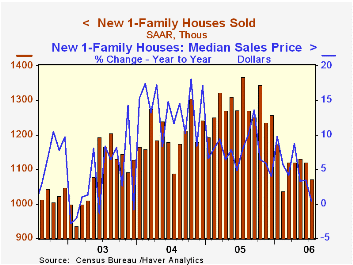
Sales of new single family home sales dropped 4.3% last month to 1.072M though a 0.9% June decline was revised shallower. Consensus expectations had been for July sales of 1.10M.
New home sales during the first seven months of this year fell 13.5% from the first seven months of 2005 and last month were 21.6% below the monthly peak last July.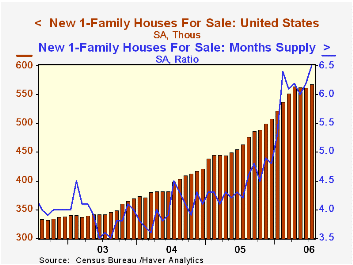
Sales in the Midwest fell the hardest last month, down 21.3% (-35.4% y/y). Sales in the South also fell 8.0% (-12.4% y/y). In the Northeast sales rose a slight 1.8% (-42.9% y/y) and sales out West recovered 11.7% (-23.4% y/y.
The number of new homes for sale rose 1.1% m/m in July and rose 22.4% y/y. The year to year breakdown by region is as follows: Northeast, 32.5%; West, 30.0%; South, 27.9%; Midwest, -1.0%.
The median sales price of a new single family home fell 1.6% to $230,000, down 10.5% from the April peak.
| U.S. New Homes | July | June | Y/Y | 2005 | 2004 | 2003 |
|---|---|---|---|---|---|---|
| Total Sales (AR, 000's) | 1,072 | 1,120 | -21.6% | 1,280 | 1,201 | 1,091 |
| Median Price (NSA) | $230,000 | $233,800 | 0.3% | $234,208 | $217,817 | $191,383 |
by Tom Moeller August 24, 2006
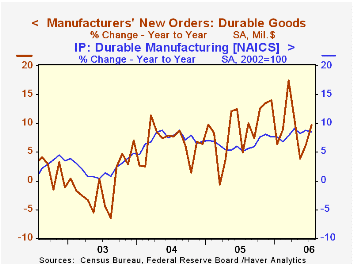
New orders for durable goods backpedaled 2.4% last month after an upwardly revised 3.5% surge during June. Consensus expectations had been for a 0.5% dip.
Again, volatile orders for nondefense aircraft & parts provided much of the volatility with a 10.0% (+0.75 y/y) drop following a 7.3% June rise. Orders for defense aircraft offset some of last month's decline with a 9.0% jump (29.0% y/y).
Orders for motor vehicle & parts also were weak last month and fell 7.0% (-4.5% y/y).
Durable goods orders less the transportation sector altogether added 0.5% to a 2.2% July increase that was double the increase estimated initially.
During the last ten years there has been a 69% correlation between the y/y change in durable goods orders and the change in output of durable goods.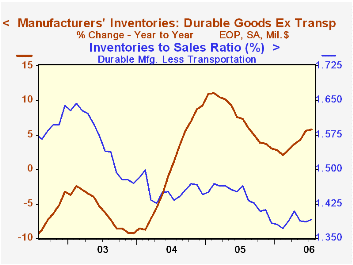
Orders for nondefense capital goods added 0.2% to the upwardly revised 2.1% June gain. Less aircraft, July orders jumped 1.5% after a 1.4% spike the month earlier which was revised up from 0.4%. During the last ten years there has been an 86% correlation between the y/y change in capital goods orders less aircraft and the y/y change in business fixed investment in equipment & software from the GDP accounts.
Orders for computers & electronic products surged 4.6% (18.0% y/y after a 6.7% June gain (revised from 3.4%). Computer orders jumped 9.1% (12.2% y/y) though orders for communications equipment fell 10.5% (+8.3% y/y). Machinery orders jumped again, by 1.9% (18.5% y/y), while orders for electrical equipment & appliances slipped 0.7% (+14.8% y/y).
Shipments of durable goods dropped 1.3% (+7.9% y/y) though shipments less the transportation sector rose 0.6% (11.3% y/y). During the last ten years there has been an 82% correlation between the y/y change in durable goods shipments and the change in industrial production of durable goods.
Order backlogs rose 1.4% (20.1% y/y) as unfilled orders for nondefense aircraft & parts rose another 1.4% (50.9% y/y). Unfilled orders less transportation nevertheless jumped 1.8% (16.2% y/y).
Durable inventories jumped 1.0% (5.4% y/y) and less the transportation sector, inventories also rose 0.9% (5.8% y/y). The inventory to sales ratio outside of the transportation sector rose slightly to its highest level since April.
| NAICS Classification | July | June | Y/Y | 2005 | 2004 | 2003 |
|---|---|---|---|---|---|---|
| Durable Goods Orders | -2.4% | 3.5% | 9.7% | 9.0% | 6.4% | -0.6% |
| Excluding Transportation | 0.5% | 2.2% | 14.6% | 9.4% | 7.6% | -1.7% |
| Nondefense Capital Goods | 0.2% | 2.1% | 11.1% | 21.4% | 5.6% | -3.4% |
| Excluding Aircraft | 1.5% | 1.4% | 13.1% | 12.3% | 2.8% | -2.0% |
by Tom Moeller August 24, 2006
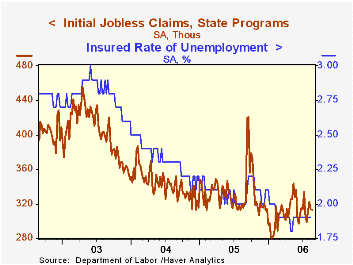
Initial claims for jobless insurance last week dipped 1,000 to 313,000 after a revised 8,000 decline the prior week. Consensus expectations had been for 315,000 claims.
During the last ten years there has been a (negative) 78% correlation between the level of initial claims and the m/m change in nonfarm payroll employment.
The four-week moving average of initial claims increased to 315,250 (-0.5% y/y).
Continuing claims for unemployment insurance fell 9,000 following a downwardly revised 28,000 increase during the previous week.
The insured rate of unemployment was steady at 1.9% where it has been since February.
Has The Internet Increased Trade? from the American Enterprise Institute is available here.
| Unemployment Insurance (000s) | 8/19/06 | 8/12/06 | Y/Y | 2005 | 2004 | 2003 |
|---|---|---|---|---|---|---|
| Initial Claims | 313 | 314 | -0.9% | 332 | 343 | 403 |
| Continuing Claims | -- | 2,492 | -3.6% | 2,662 | 2,924 | 3,532 |
by Carol Stone August 24, 2006
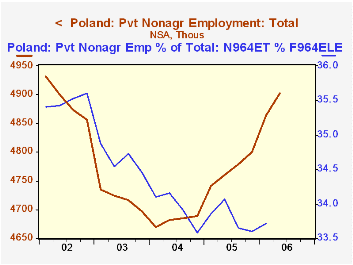
Employment is rising in Europe, as we have noted frequently here recently. Poland, whose Central Statistical Office issued some July data today, is no exception. The enterprise sector saw an increase of 10,000 in July, following 18,000 in June, with an overall 3.3% gain from a year ago. This sector covers about half of Poland's private employment and about 34% of total employment. A cyclical downturn in 2003 and 2004 reduced the share of "enterprise" employment in the total, but that had stabilized by early this year.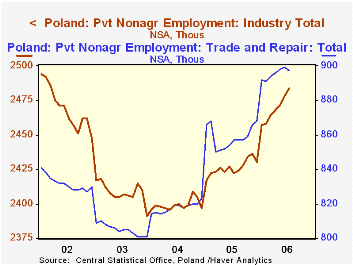
Jobs are increasing in every industry segment. Traditional "industry" -- mining, manufacturing and utilities -- has seen 2.6% growth over the past year. "Other", a group we calculated as the sum of tourism, transportation, and business services, expanded by 3.4% and construction by 4.4%. "Trade and repair", which includes wholesale and retail trade outlets, repair shops and motor vehicle service stations and repairs, has the largest increase, 4.7%, which amounts to 40,000 more jobs.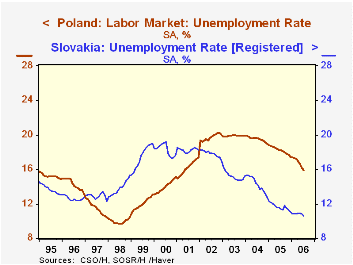
The good employment picture notwithstanding, unemployment remains high in Poland. It was 15.9% (seasonally adjusted by Haver Analytics) in July. This is down from recent recessionary highs that hovered around 20%, but it is far higher than neighboring countries. Of the larger Central and Eastern European nations, only Slovakia (recently 10.6%) and Bulgaria (10%) have unemployment rates higher than 10%. Even Russia reports just 8% for July. So there would appear to be considerable room for expansion in the Polish economy, with about 2.5 million people to put to work, even on top of the most recent job growth.
| Poland: NSA, Thous | July 2006 | June 2006 | May 2006 | July 2005 | 2005 | 2004 | 2003 |
|---|---|---|---|---|---|---|---|
| Employment in Enterprise Sector | 4928 | 4918 | 4901 | 4772 | 4770 | 4681 | 4718 |
| Industry | 2484 | 2478 | 2471 | 2422 | 2426 | 2399 | 2408 |
| Construction | 335 | 332 | 328 | 321 | 319 | 316 | 354 |
| Trade | 897 | 899 | 898 | 857 | 859 | 818 | 805 |
| All Other* | 1212 | 1209 | 1204 | 1172 | 1166 | 1148 | 1151 |
| Reg. Unemployment (SA) | 2488 | 2531 | 2608 | 2862 | 2871 | 3091 | 3179 |
| Rate (SA, %) | 15.9 | 16.2 | 16.6 | 18.2 | 18.2 | 19.5 | 19.9 |

Tom Moeller
AuthorMore in Author Profile »Prior to joining Haver Analytics in 2000, Mr. Moeller worked as the Economist at Chancellor Capital Management from 1985 to 1999. There, he developed comprehensive economic forecasts and interpreted economic data for equity and fixed income portfolio managers. Also at Chancellor, Mr. Moeller worked as an equity analyst and was responsible for researching and rating companies in the economically sensitive automobile and housing industries for investment in Chancellor’s equity portfolio. Prior to joining Chancellor, Mr. Moeller was an Economist at Citibank from 1979 to 1984. He also analyzed pricing behavior in the metals industry for the Council on Wage and Price Stability in Washington, D.C. In 1999, Mr. Moeller received the award for most accurate forecast from the Forecasters' Club of New York. From 1990 to 1992 he was President of the New York Association for Business Economists. Mr. Moeller earned an M.B.A. in Finance from Fordham University, where he graduated in 1987. He holds a Bachelor of Arts in Economics from George Washington University.
More Economy in Brief


