 Global| Jun 14 2010
Moving Around The United States
by:Tom Moeller
|in:Economy in Brief
Summary
Population growth in the United States has been declining steadily since the early-1990s. Specifically, growth of 1.0% during the last nine years is off from the early-1990s' high of 1.4% and is well below the 1.5%-2.5% growth rates [...]
Population growth in the United States has been declining steadily since the early-1990s. Specifically, growth of 1.0% during the last nine years is off from the early-1990s' high of 1.4% and is well below the 1.5%-2.5% growth rates from the mid-1940s to the mid-1960s. Analyzing all of the reasons for the slowdown is beyond the scope of this presentation, yet one thing is clear. The Southern and Western states have seen accelerated growth at the expense of most other sections of the country.
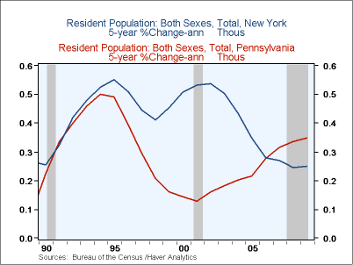
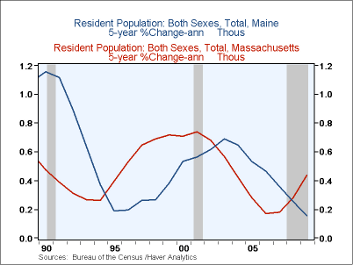
Suffering the greatest decline has been population growth in the country's extreme Northeast. Maine actually experienced net out-migration last year. Chronically slow population growth also characterizes the Northeast and the Midwestern regions with relatively high housing costs and the falloff in factory sector output as a percent of the economy. Michigan also experienced net outmigration during the last four years.
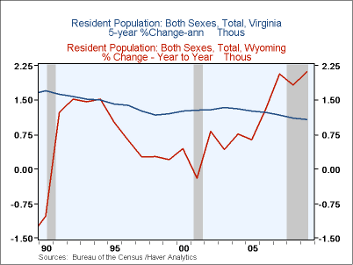
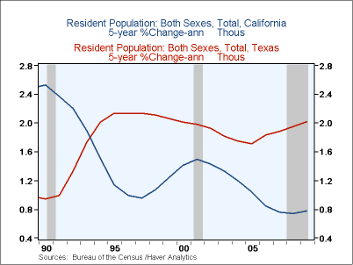
Net-population advances characterizes states in most other regions of the country. During the last five years the strongest growth rates have been in Wyoming, Texas, North Carolina and Colorado. Relatively low housing costs, an aging population as well as an increased ability to communicate electronically has aided population growth in these states. California, however, has seen population growth decelerate sharply with high unemployment and high home-foreclosures.
The data used in the above analysis is available in Haver's USPOP database.
| Population Growth (%) | 2009 | 2008 | 2007 | 2006 |
|---|---|---|---|---|
| United States | 0.9 | 0.9 | 1.0 | 1.0 |
| Maine | -0.1 | 0.2 | 0.2 | 0.3 |
| New Hampshire | 0.2 | 0.3 | 0.4 | 0.8 |
| Vermont | 0.1 | 0.1 | 0.1 | 0.2 |
| New York | 0.4 | 0.2 | 0.3 | 0.1 |
| New Jersey | 0.5 | 0.3 | 0.1 | 0.0 |
| Massachusetts | 0.8 | 0.7 | 0.5 | 0.2 |
| Pennsylvania | 0.3 | 0.4 | 0.4 | 0.4 |
| Louisiana | 1.0 | 1.7 | 3.2 | -5.7 |
| Virginia | 1.1 | 1.0 | 1.0 | 1.1 |
| North Carolina | 1.5 | 2.0 | 2.2 | 2.3 |
| Georgia | 1.4 | 1.7 | 2.2 | 2.6 |
| Florida | 0.7 | 0.8 | 1.1 | 1.1 |
| Michigan | -0.3 | -0.5 | -0.3 | -0.1 |
| Illinois | 0.5 | 0.5 | 0.5 | 0.3 |
| Indiana | 0.5 | 0.7 | 0.7 | 0.8 |
| Minnesota | 0.7 | 0.8 | 0.8 | 0.8 |
| Ohio | 0.1 | 0.1 | 0.3 | 0.2 |
| Kansas | 0.8 | 0.8 | 0.7 | 0.5 |
| Texas | 2.0 | 2.0 | 2.0 | 2.5 |
| Arizona | 1.5 | 2.2 | 2.8 | 3.6 |
| Colorado | 1.8 | 1.9 | 1.9 | 2.0 |
| Wyoming | 2.1 | 1.8 | 2.1 | 1.3 |
| California | 1.0 | 1.0 | 0.7 | 0.5 |
| Washington | 1.5 | 1.6 | 1.5 | 1.8 |
| Nevada | 1.0 | 1.9 | 3.0 | 3.5 |
Tom Moeller
AuthorMore in Author Profile »Prior to joining Haver Analytics in 2000, Mr. Moeller worked as the Economist at Chancellor Capital Management from 1985 to 1999. There, he developed comprehensive economic forecasts and interpreted economic data for equity and fixed income portfolio managers. Also at Chancellor, Mr. Moeller worked as an equity analyst and was responsible for researching and rating companies in the economically sensitive automobile and housing industries for investment in Chancellor’s equity portfolio. Prior to joining Chancellor, Mr. Moeller was an Economist at Citibank from 1979 to 1984. He also analyzed pricing behavior in the metals industry for the Council on Wage and Price Stability in Washington, D.C. In 1999, Mr. Moeller received the award for most accurate forecast from the Forecasters' Club of New York. From 1990 to 1992 he was President of the New York Association for Business Economists. Mr. Moeller earned an M.B.A. in Finance from Fordham University, where he graduated in 1987. He holds a Bachelor of Arts in Economics from George Washington University.
More Economy in Brief
 Global| Feb 05 2026
Charts of the Week: Balanced Policy, Resilient Data and AI Narratives
by:Andrew Cates


