 Global| Oct 25 2006
Mortgage Applications Ticked Higher
by:Tom Moeller
|in:Economy in Brief
Summary
The total number of mortgage applications ticked 0.5% higher last week following two consecutive weeks of hefty decline, according to the Mortgage Bankers Association. Due to a sharp increase at the end of last month, the average [...]
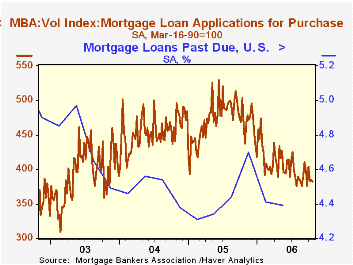
The total number of mortgage applications ticked 0.5% higher last week following two consecutive weeks of hefty decline, according to the Mortgage Bankers Association. Due to a sharp increase at the end of last month, the average level of applications during October nevertheless is 0.3% higher than during September.
A 1.8% w/w rise in applications to refinance followed two consecutive weeks of decline. Refis in October are 4.9% higher than during September.
Moving the other way, purchase applications slipped 0.6%. That lowered the average level of purchase apps in October 3.1% below September which rose 3.2% from August.
During the last ten years there has been a 58% correlation between the y/y change in purchase applications and the change in new plus existing single family home sales. sharp increases late last month.
The effective interest rate on a conventional 30-year mortgage rose to 6.57%. The peak for 30 year financing was 7.08% late in June. The rate for 15-year financing also rose slightly to w/w to 6.29% versus 6.20% averaged last month. The peak rate was 6.75%. Interest rates on 15 and 30 year mortgages are closely correlated (>90%) with the rate on 10 year Treasury securities.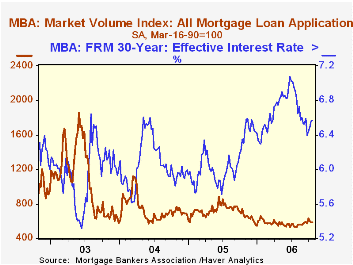
During the last ten years there has been a (negative) 79% correlation between the level of applications for purchase and the effective interest rate on a 30-year mortgage.
The Mortgage Bankers Association surveys between 20 to 35 of the top lenders in the U.S. housing industry to derive its refinance, purchase and market indexes. The weekly survey accounts for more than 40% of all applications processed each week by mortgage lenders. Visit the Mortgage Bankers Association site here.
The latest release from the Mortgage Bankers Association indicated that 4.4% of mortgage loans were past due during the second quarter of this year, down sharply from the 4.7% past due at the end of 2005. Foreclosure had been started, however, on an increased 4.43% of loans versus 4.36% at the 2003 low.
Do Households Benefit from Financial Deregulation and Innovation? The Case of the Mortgage Market from the Federal Reserve Bank of Boston is available here.
| MBA Mortgage Applications (3/16/90=100) | 10/20/06 | 10/13/06 | Y/Y | 2005 | 2004 | 2003 |
|---|---|---|---|---|---|---|
| Total Market Index | 588.6 | 585.8 | -13.3% | 708.6 | 735.1 | 1,067.9 |
| Purchase | 382.4 | 384.7 | -18.0% | 470.9 | 454.5 | 395.1 |
| Refinancing | 1,790.4 | 1,758.2 | -6.6% | 2,092.3 | 2,366.8 | 4,981.8 |
by Tom Moeller October 25, 2006
A Supervisor's Perspective on Mortgage Markets and Mortgage Lending Practices, remarks by Fed Governor Susan Schmidt Bies, are available here.
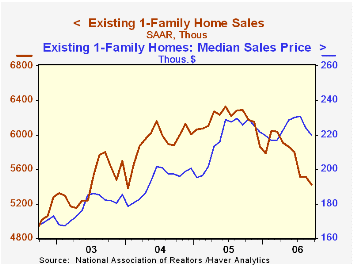
| Existing Home Sales (000, AR) | September | August | Y/Y | 2005 | 2004 | 2003 |
|---|---|---|---|---|---|---|
| Total Home Sales | 6,180 | 6,300 | -14.2% | 7,064 | 6,722 | 6,176 |
| Single Family Home Sales | 5,420 | 5,510 | -13.8% | 6,170 | 5,912 | 5,443 |
| Single Family Median Home Price (000) | $219.8 | $224.0 | -2.5% | $217.5 | $192.8 | $178.3 |
by Tom Moeller October 25, 2006
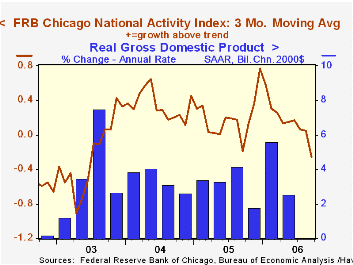
The National Activity Index (CFNAI) from the Federal Reserve Bank of Chicago dropped to a negative 0.51 in September, the third negative monthly reading in a row. As a result, the three-month moving average of the CFNAI fell to -0.25, its first negative value in a year.
A zero value of the CFNAI indicates that the economy is expanding at its historical trend rate of growth. During the last twenty years there has been a 68% correlation between the level of the CFNAI and q/q growth in real GDP.
The CFNAI is a weighted average of 85 indicators of economic activity. The indicators reflect activity in the following categories: production and income, the labor market, personal consumption and housing, manufacturing and trade sales, and inventories & orders.
The latest CFNAI report is available here.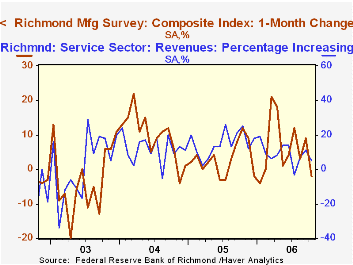
The Federal Reserve Bank of Richmond also indicated that its October Composite Index from the manufacturing survey at -2 was at its lowest level since January. During the last ten years there has been a 38% correlation between the diffusion index level and the one month change in U.S. manufacturing industrial production. The October report can be found here.
The Richmond Fed's survey of the service sector also fell m/m but remained in positive territory. The percentage of firms reporting increasing revenues fell to 5%, the lowest percentage since July, but the percentage of employees held at a high 13%. The latest report is available here.
| Chicago Fed | September | August | Sept. '05 | 2005 | 2004 | 2003 |
|---|---|---|---|---|---|---|
| CFNAI | -0.51 | -.06 | -0.74 | 0.20 | 0.36 | -0.15 |
by Tom Moeller October 25, 2006
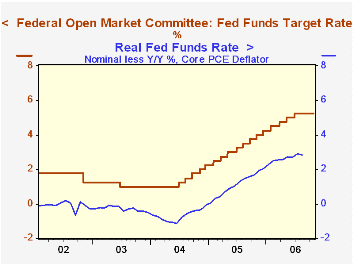
The target interest rate for Federal funds was held steady at 5.25%, where it has been since late June, at today's meeting of the Federal Open Market Committee.
Voting against the decision for the third consecutive meeting was Richmond Federal Reserve Bank President Jeffrey M. Lacker, who preferred an increase of 25 basis points in the federal funds rate target.
The discount rate also was held steady at 6.25%.
Today's decision was widely expected by analysts.
The Fed's rationale for leaving rates unchanged was that "Economic growth has slowed over the course of the year, partly reflecting a cooling of the housing market. Going forward, the economy seems likely to expand at a moderate pace."
The need for continued vigilance was stressed by the Fed. "... the Committee judges that some inflation risks remain. The extent and timing of any additional firming that may be needed to address these risks will depend on the evolution of the outlook for both inflation and economic growth, as implied by incoming information
For the complete text of the Fed's latest press release please follow this link.
Inflation Persistence in an Era of Well-Anchored Inflation Expectations from the Federal Reserve Bank of San Francisco can be found here
Japan's Trade Accounts Benefit from Lower Oil Prices and Rising Exportsby Carol Stone October 25, 2006

A week ago, we wrote here about further deterioration in trade accounts in Europe for August as energy costs continued to raise import values. We called this "Old News", since we knew already that petroleum prices had already started to drop in September. Sure enough, in today's report of Japan's trade for September, some improvement is evident. The trade surplus rose to ¥1.014 trillion from ¥949 billion in September 2005. Imports were still up, rising 16.9% from a year ago to ¥5.818 trillion. But within this total, "mineral fuels" had their smallest year-on-year increase, 18.2%, since July 2004. In this heavy oil importing nation, mineral fuels peaked at a 72.7% yearly surge in February 2006. 
News services today highlight strength in exports, especially motor vehicles, as a reason for the better trade surplus, and this is also the case. On the month, transportation equipment rose 19.9%, yielding a third successive month of 20%-plus yearly increases. A good many of the vehicle shipments head for the US, and the surplus with the US increased to ¥913 billion in September from ¥711 billion a year ago. 
One other point in Japan's favor is a renewed acceleration of exports to China. After a significant slowdown in early and mid-2005, Japan's shipments there have also seen a sustained period of year-on-year growth around 20%. These gains, while not erasing Japan's trade deficit with China, have kept it range-bound near ¥200 billion monthly for the last five months. These developments with the US and China help emphasize that trade relations can be improved by gains in exports, not only with restraints on imports.
| Japan, Bil.¥ | Sept 2006 | Aug 2006 | July 2006 | Sept 2005 | Monthly Averages|||
|---|---|---|---|---|---|---|---|
| 2005 | 2004 | 2003 | |||||
| Trade Balance, NSA | 1014 | 196 | 858 | 949 | 726 | 996 | 849 |
| Trade Balance, SA | 420 | 661 | 757 | 642 | |||
| Exports, SA* | 6360 | 6435 | 6331 | 5592 | 5471 | 5097 | 4546 |
| % Change* | 3.2 | 0.2 | 1.3 | 14.2 | 7.3 | 12.1 | 4.7 |
| Imports, SA* | 5940 | 5774 | 5574 | 4951 | 4746 | 4101 | 3697 |
| % Change* | 0.6 | 4.3 | -6.9 | 16.8 | 15.7 | 10.9 | 5.1 |

Tom Moeller
AuthorMore in Author Profile »Prior to joining Haver Analytics in 2000, Mr. Moeller worked as the Economist at Chancellor Capital Management from 1985 to 1999. There, he developed comprehensive economic forecasts and interpreted economic data for equity and fixed income portfolio managers. Also at Chancellor, Mr. Moeller worked as an equity analyst and was responsible for researching and rating companies in the economically sensitive automobile and housing industries for investment in Chancellor’s equity portfolio. Prior to joining Chancellor, Mr. Moeller was an Economist at Citibank from 1979 to 1984. He also analyzed pricing behavior in the metals industry for the Council on Wage and Price Stability in Washington, D.C. In 1999, Mr. Moeller received the award for most accurate forecast from the Forecasters' Club of New York. From 1990 to 1992 he was President of the New York Association for Business Economists. Mr. Moeller earned an M.B.A. in Finance from Fordham University, where he graduated in 1987. He holds a Bachelor of Arts in Economics from George Washington University.
More Economy in Brief


