 Global| Mar 09 2005
Mortgage Applications Slip Further
by:Tom Moeller
|in:Economy in Brief
Summary
The Mortgage Bankers Association reported that mortgage applications slipped 0.7% last week, the fourth consecutive week of decline. Applications to refinance declined 4.6% following the prior week's 9.9% w/w drop. Purchase [...]

The Mortgage Bankers Association reported that mortgage applications slipped 0.7% last week, the fourth consecutive week of decline.
Applications to refinance declined 4.6% following the prior week's 9.9% w/w drop.
Purchase applications rose 2.7% on top of the prior week's 5.3% gain and began the month 4.7% above the February average. During the last ten years there has been a 59% correlation between the y/y change in purchase applications and the change in new plus existing home sales.
The effective interest rate on a conventional 30-year mortgage fell to 5.94% versus 5.98% the prior week. The effective rate on a 15-year mortgage also rose to 5.55% last week.
The Mortgage Bankers Association surveys between 20 to 35 of the top lenders in the U.S. housing industry to derive its refinance, purchase and market indexes. The weekly survey accounts for more than 40% of all applications processed each week by mortgage lenders. Visit the Mortgage Bankers Association site here.
Federal Reserve Board Governor Ben S. Bernanke's speech titled The Economic Outlook can be viewed here.
Loan Quality and How it Reflects the Overall Economy from Federal Reserve Board Governor Mark W. Olson is available here.
| MBA Mortgage Applications (3/16/90=100) | 03/04/05 | 02/25/05 | Y/Y | 2004 | 2003 | 2002 |
|---|---|---|---|---|---|---|
| Total Market Index | 704.8 | 710.1 | -20.7% | 735.1 | 1,067.9 | 799.7 |
| Purchase | 451.7 | 440.0 | 5.4% | 454.5 | 395.1 | 354.7 |
| Refinancing | 2,176.8 | 2,281.1 | -39.0% | 2,366.8 | 4,981.8 | 3,388.0 |
by Carol Stone March 9, 2005
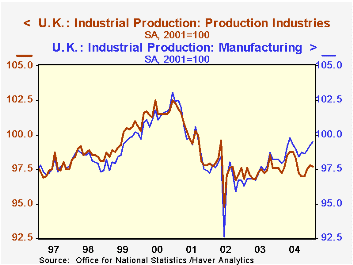
Industry in Europe is generally gaining ground. January industrial production reports for five countries indicate firming trends, particularly in manufacturing sectors. In the UK factory output rose 0.2% in January and is 1.3% ahead of a year ago. In Germany, it was up a substantial 3.9% in the month and 4.4% from January 2004. At the same time, total industry output was restrained in both of these countries by weakness in other industry; in the UK, a steep downtrend in oil and gas extraction is pulling mining activity down sharply: 1.4% in January and 7.7% in the last year. Germany's mining sector carries a smaller weight the total, but it too has been generally negative: a 2.8% drop in January interrupted what had been a developing recovery and left the mining index 4.2% below the year-earlier amount. All told, then, industrial production in the UK was off marginally in January and just barely above a year ago. In Germany, total output is managing a climb, although somewhat more gradual than the manufacturing sector alone (this applies to Germany's "production excluding construction", to make the coverage comparable to the UK).
The same combination holds in the Netherlands: factory output rose 2.0% in January, but total output decreased 0.9%. Dutch mining activity, though, had been quite strong through much of 2004 and has moved erratically, with wide up and down swings since October.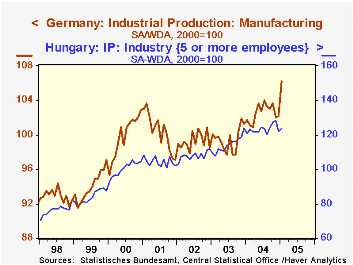
In two smaller regions, production is headed higher, albeit somewhat irregularly. In Hungary total output was up 1.3% in January and 2.4% from the year-ago. This was a turnaround from a 1.8% decrease over the 12 months ended December. In Turkey, January's output eased 0.4% from December, but has climbed 6.5% in the last year.
As we have pointed out here before, economic activity in Europe is holding up well, despite the strength in the euro, and as well, despite rising energy costs. In part, this results from the importance of trade within Europe itself and with other countries whose currency is not tied to the dollar. This strength in the euro has also diminished the force on those countries of the rise in dollar-priced energy products.
| European Industrial Production | Jan 2005 | Dec 2004 | Year Ago | 2004 | 2003 | 2002 |
|---|---|---|---|---|---|---|
| UK (2001=100) | 97.7 | 97.8 | 97.6 | 97.8 | 97.3 | 97.5 |
| Manufacturing | 99.5 | 99.3 | 98.2 | 98.8 | 97.4 | 96.9 |
| Germany (2000=100) | 105.6 | 102.3 | 101.7 | 102.4 | 99.5 | 99.1 |
| Manufacturing | 106.2 | 102.2 | 101.7 | 102.6 | 99.5 | 99.3 |
| Netherlands (2000=100) | 98.9 | 99.8 | 99.9 | 99.9 | 97.7 | 100.1 |
| Manufacturing | 97.6 | 95.7 | 98.2 | 96.1 | 95.8 | 98.5 |
| Hungary (2000=100) | 123.4 | 121.9 | 120.6 | 123.3 | 114.3 | 107.8 |
| Turkey (1997=100) | 127.9 | 128.4 | 120.1 | 123.4 | 112.4 | 103.4 |

Tom Moeller
AuthorMore in Author Profile »Prior to joining Haver Analytics in 2000, Mr. Moeller worked as the Economist at Chancellor Capital Management from 1985 to 1999. There, he developed comprehensive economic forecasts and interpreted economic data for equity and fixed income portfolio managers. Also at Chancellor, Mr. Moeller worked as an equity analyst and was responsible for researching and rating companies in the economically sensitive automobile and housing industries for investment in Chancellor’s equity portfolio. Prior to joining Chancellor, Mr. Moeller was an Economist at Citibank from 1979 to 1984. He also analyzed pricing behavior in the metals industry for the Council on Wage and Price Stability in Washington, D.C. In 1999, Mr. Moeller received the award for most accurate forecast from the Forecasters' Club of New York. From 1990 to 1992 he was President of the New York Association for Business Economists. Mr. Moeller earned an M.B.A. in Finance from Fordham University, where he graduated in 1987. He holds a Bachelor of Arts in Economics from George Washington University.
More Economy in Brief


