 Global| Mar 20 2006
Leading Economic Indicators Fell
by:Tom Moeller
|in:Economy in Brief
Summary
The Composite Index of Leading Economic Indicators fell 0.2% last month following four months of increase, reported the Conference Board. The decline about matched Consensus expectations for a 0.3% drop but it was accompanied by a [...]
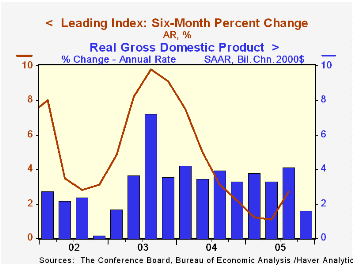
The Composite Index of Leading Economic Indicators fell 0.2% last month following four months of increase, reported the Conference Board. The decline about matched Consensus expectations for a 0.3% drop but it was accompanied by a revision to January which halved that month's gain to 0.5% from the 1.1% surge estimated initially.
During the last ten years there has been a 43% correlation between the six-month change in the leading indicators and quarterly growth in real GDP.
The breadth of one month gain amongst the 10 components of the leading index fell to 50% in February from 70% in January although over six months the breadth of gain in the leaders surged back to 90%.
Higher initial claims for unemployment insurance, easier vendor performance, lower consumer expectations and lower building permits made large negative contributions to last month's decline in the leading index.
The minimal 0.01 percentage point positive contribution from the spread between yields on the 10 year Treasury Note and the Fed funds rate was the was the second in two months. The method of calculating the contribution to the index from the interest rate yield spread has been revised. A negative contribution will now occur only when the spread inverts rather than when declining as in the past. More details can be found here.
The leading index is based on eight previously reported economic data series. Two series, orders for consumer goods and orders for capital goods, are estimated.
The coincident indicators rose 0.3% following an unchanged reading for January, initially reported at +0.2%. All of the four component series rose both last month and during the last six months. During the last ten years there has been a 64% correlation between the change in the coincident indicators and real GDP.
The lagging indicators rose just 0.1% following a downwardly revised 0.5% January gain. Over the last six months, three quarters of the series' components rose. The ratio of coincident to lagging indicators, a measure of actual economic performance versus excess, reversed most of the prior month's decline.
Visit the Conference Board's site for coverage of leading indicator series from around the world.
| Business Cycle Indicators | Feb | Jan | 6 Month Chg., AR | 2005 | 2004 | 2003 |
|---|---|---|---|---|---|---|
| Leading | -0.2% | 0.5% | 4.7% | 2.3% | 7.4% | 5.0% |
| Coincident | 0.3% | 0.0% | 2.0% | 2.2% | 2.5% | 0.4% |
| Lagging | 0.1% | 0.5% | 3.7% | 3.5% | 0.0% | -0.0% |
by Tom Moeller March 20, 2006
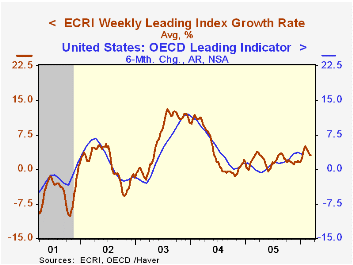
The weekly leading index of the US economy published by the Economic Cycle Research Institute (ECRI) slipped 0.1% last week. The decline was the fifth in the last six weeks and lowered the index's six month growth rate to 3.0% from an early February high of 5.1%.
During the last ten years there has been a 53% correlation between the change in the weekly leading index and US real GDP growth during the following quarter. The correlation has risen to 71% during the last five years.
The very recent deceleration in the leaders' growth follows improvement early this year. That slowdown mirrors the pattern of slightly slower growth in the leading series from the Conference Board and the OECD.
Visit the Economic Cycle Research Institute for analysis of US and international business cycles.
| Economic Cycle Research Institute | 3/10/06 | 12/30/05 | Y/Y | 2005 | 2004 | 2003 |
|---|---|---|---|---|---|---|
| Weekly Leading Index | 136.8 | 135.7 | 0.8% | 134.5 | 132.6 | 124.9 |
| 6 Month Growth Rate | 3.0% | 3.1% | 1.9% | 4.2% | 6.7% |
by Louise Curley March 20, 2006
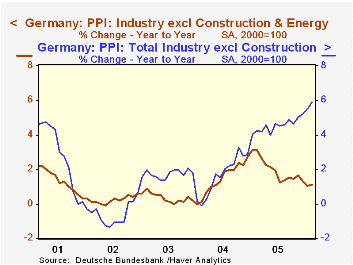
Producer prices in Germany rose 0.7% in February. Prices of intermediate goods were up 0.56%, those of investment goods fell 0.10% and prices of consumer goods were unchanged. The rise was due almost entirely to continued rising energy costs. As the first chart shows, energy price increases have greatly exceeded those of the index excluding construction and energy since early 2005, widening the gap between the two series
The rise in February was larger than expected and is likely to increase inflation concerns of the European Central Bank (ECB). The ECB has already raised its key interest rate from 2%, which had been in place since June 2003, to 2.25% last December and again in March to 2.5%.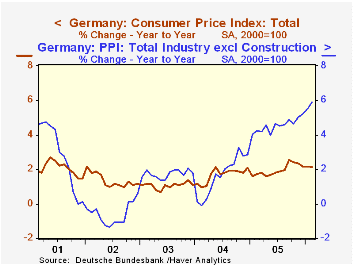
While the ECB focuses on the consumer price index, it is mindful of the potential impact that rising producer prices may have on consumer prices. The second chart shows the course of consumer and producer prices over the past five years.The rise in producer prices over the past year has been bigger and more persistent than previous rises and is, therefore, more likely to have a significant impact on consumer prices.
Even if energy prices should stabilize or decline, these second-round effects of the high energy prices could soon begin to affect consumer prices particularly as the economy continues to show signs of increased activity. Early this month, February new orders, both foreign and domestic were reported to have increased and last week, Manpower reported that German employers intended to increase employment in the first two quarters of this year.
| German Producer Price Index (2000=100) | Feb 06 | Jan 06 | Feb 05 | M/M % | Y/Y % | 2005 | 2004 | 2003 |
|---|---|---|---|---|---|---|---|---|
| Total ex construction | 114.9 | 114.1 | 108.5 | 0.70 | 5.89 | 110.7 | 105.8 | 104.1 |
| Intermediate goods | 108.2 | 107.6 | 106.4 | 0.56 | 1.69 | 106.5 | 103.2 | 100.4 |
| Investment goods | 103.3 | 103.4 | 102.9 | -0.10 | 0.39 | 103.0 | 102.1 | 101.8 |
| Consumer goods | 107.7 | 107.7 | 106.4 | 0.00 | 1.22 | 106.9 | 105.2 | 104.2 |
| Energy | 148.8 | 145.8 | 121.2 | 2.06 | 22.77 | 131.5 | 115.4 | 112.6 |
| Total ex construction & energy | 106.7 | 106.4 | 105.5 | 0.28 | 1.14 | 105.5 | 103.5 | 102.0 |
| Consumer Price Index | 109.4 | 109.2 | 107.1 | 0.18 | 2.15 | 108.3 | 106.2 | 104.5 |

Tom Moeller
AuthorMore in Author Profile »Prior to joining Haver Analytics in 2000, Mr. Moeller worked as the Economist at Chancellor Capital Management from 1985 to 1999. There, he developed comprehensive economic forecasts and interpreted economic data for equity and fixed income portfolio managers. Also at Chancellor, Mr. Moeller worked as an equity analyst and was responsible for researching and rating companies in the economically sensitive automobile and housing industries for investment in Chancellor’s equity portfolio. Prior to joining Chancellor, Mr. Moeller was an Economist at Citibank from 1979 to 1984. He also analyzed pricing behavior in the metals industry for the Council on Wage and Price Stability in Washington, D.C. In 1999, Mr. Moeller received the award for most accurate forecast from the Forecasters' Club of New York. From 1990 to 1992 he was President of the New York Association for Business Economists. Mr. Moeller earned an M.B.A. in Finance from Fordham University, where he graduated in 1987. He holds a Bachelor of Arts in Economics from George Washington University.
More Economy in Brief


