 Global| Dec 27 2005
Inverted Treasury Yield Curve Signals Less Liquidity
by:Tom Moeller
|in:Economy in Brief
Summary
At 4.40%, current yields on 10 Year Treasury securities for the most part match the yields on the 2 Year. Fed Chairman Alan Greenspan, and many economists, have indicated that the yield curve's ability to signal changes in economic [...]

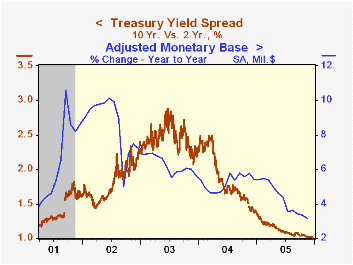
At 4.40%, current yields on 10 Year Treasury securities for the most part match the yields on the 2 Year. Fed Chairman Alan Greenspan, and many economists, have indicated that the yield curve's ability to signal changes in economic conditions has slackened as financial markets have broadened and become more complex.
Narrow Money, Broad Money, and the Transmission of Monetary Policy from the Federal Reserve Bank of Richmond is available here.
In the past the move of toward parity, let alone inversion, of the 10-2 Year spread has preceded recessions in the U.S. Without fail it has signaled a marked slowing of liquidity and recently the growth in the monetary base has slowed to 3% from 9% in 2002.
The slowing reflects the effects of higher interest rates on consumers' inclination to borrow and spend as well as banks' inclination to lend.
Certainly, the U.S. economy is "awash in cash." But in a twelve trillion dollar economy such as the U.S., growth is determined at the margin.
Economic Sentiment in Slovakia Slows in Decemberby Louise Curley December 27, 2005

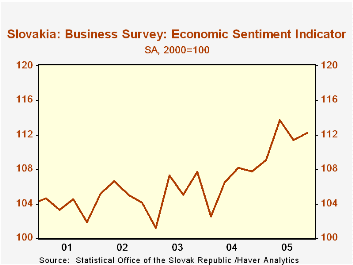
The Economic Sentiment Indicator of Slovakia has been on a generally rising trend since early 2004. (See the first chart.) The index rose 0.4% in December to 113.4 (2000=100) from November and was 7.0% above the December, 2004 level of 106.0. The index is based on four confidence indicators that measure the balance between optimists and pessimists. These are the Industrial Confidence Indicator which has a weight of 40% and the Construction Confidence, the Consumer Confidence and the Retail Trade Confidence indicators each of which has a weight of 20%. A strong rise in confidence in the retail trade sector overcame weakness in confidence in the Industrial, Construction and Consumer sectors. 
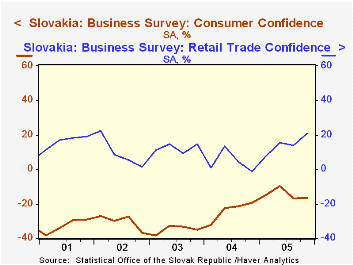
Consumers have generally taken a dim view of the economy. In December there were 17.8% more pessimists than optimists among consumers, an increase of 3.2 percentage points from November and 1.0 percentage points from December, 2004. Until the recent deterioration in consumer confidence, it had shown an improving trend starting in early 2004. In spite of the generally pessimistic view of consumers, retailers have consistently been, on balance, optimistic. In December the balance of optimists for retail trade was 23.0%, up from 22.0% in November and from a -6.7 in December of 2004. The contrast between the trends in consumer confidence and that of the retailers is shown in the second chart. 
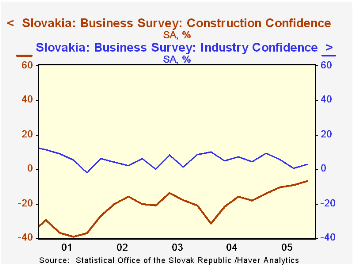
Similar trends are found in comparing confidence in the Industrial and Constructions sectors, as shown in the third chart. Except for a small excess of pessimists in late 2001 optimists have until recently outweighed pessimists in the Industrial sector while there has been a preponderance of pessimists in the construction sector. In December, however there was another slight excess of pessimists in the industrial sector as the 6.7% excess of optimists in November fell 7.4 percentage points to 0.7% excess of pessimists. The 6.5% excess of pessimists in the construction sector in December was 2.0 percentage points above November but it was 12.5 percentage points lower than that of December, 2004.
| Slovakia | Dec 05 | Nov 05 | Dec 04 | M/M Dif | Y/Y Dif | 2005 | 2004 | 2003 |
|---|---|---|---|---|---|---|---|---|
| Economic Sentiment Indicator (2000=100) | 113.4 | 112.9 | 106.0 | 0.44* | 6.98* | 111.6 | 106.2 | 105.3 |
| Components (Balances) | ||||||||
| Industrial confidence (40%) | -0.7 | 6.7 | -0.3 | -7.4 | -0.4 | 4.6 | 6.8 | 4.6 |
| Construction confidence (20%) | -6.5 | -4.5 | -19.0 | -2.0 | 12.5 | -10.2 | -21.8 | -18.3 |
| Retail trade confidence (20%) | 23.0 | 22.0 | -6.7 | 3.0 | 31.7 | 14.5 | 4.4 | 12.4 |
| Consumer confidence (20%) | -17.8 | -14.6 | -16.8 | -3.2 | -1.0 | -14.6 | -23.9 | -34.8 |
Tom Moeller
AuthorMore in Author Profile »Prior to joining Haver Analytics in 2000, Mr. Moeller worked as the Economist at Chancellor Capital Management from 1985 to 1999. There, he developed comprehensive economic forecasts and interpreted economic data for equity and fixed income portfolio managers. Also at Chancellor, Mr. Moeller worked as an equity analyst and was responsible for researching and rating companies in the economically sensitive automobile and housing industries for investment in Chancellor’s equity portfolio. Prior to joining Chancellor, Mr. Moeller was an Economist at Citibank from 1979 to 1984. He also analyzed pricing behavior in the metals industry for the Council on Wage and Price Stability in Washington, D.C. In 1999, Mr. Moeller received the award for most accurate forecast from the Forecasters' Club of New York. From 1990 to 1992 he was President of the New York Association for Business Economists. Mr. Moeller earned an M.B.A. in Finance from Fordham University, where he graduated in 1987. He holds a Bachelor of Arts in Economics from George Washington University.
More Economy in Brief
 Global| Feb 05 2026
Charts of the Week: Balanced Policy, Resilient Data and AI Narratives
by:Andrew Cates


