Global| Jun 21 2007
Initial Claims for Unemployment Insurance Higher
by:Tom Moeller
|in:Economy in Brief
Summary
Initial unemployment insurance claims moved higher last week by 10,000 to 324,000 after increases of 2,000 and 3,000 during the prior two weeks. During the last ten years there has been a (negative) 77% correlation between the level [...]
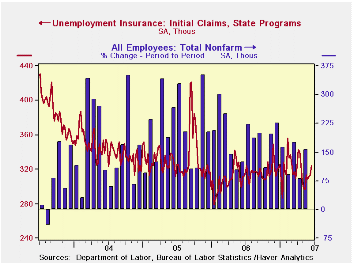
Initial unemployment insurance claims moved higher last week by 10,000 to 324,000 after increases of 2,000 and 3,000 during the prior two weeks.
During the last ten years there has been a (negative) 77% correlation between the level of initial claims and the m/m change in nonfarm payroll employment.
The latest weekly figure covers the survey period for June payroll employment and claims rose 28,000 (9.5%) from the May survey period.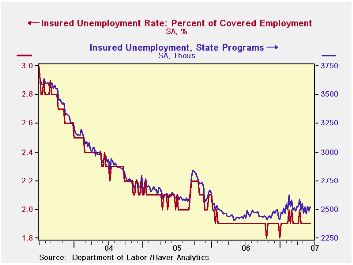
The four-week moving average of initial claims rose slightly to 314,500 (1.0% y/y).
Continuing claims for unemployment insurance increased 39,000 following a 46,000 decline during the week prior.
The insured rate of unemployment remained at 1.9%, about where it's beensince February.
What Do Worker Flows Tell Us About Cyclical Fluctuations in Employment? from the Federal Reserve Bank of Philadelphia can be found here.
| Unemployment Insurance (000s) | 06/16/07 | 06/07 | Y/Y | 2006 | 2005 | 2004 |
|---|---|---|---|---|---|---|
| Initial Claims | 324 | 314 | 3.8% | 313 | 331 | 343 |
| Continuing Claims | -- | 2,523 | 3.4% | 2,459 | 2,662 | 2,924 |
by Carol Stone June 21, 2007
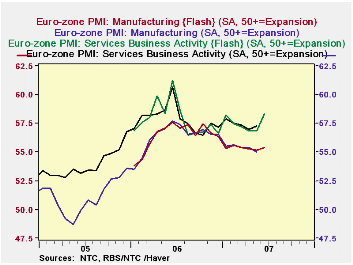
Industrial activity in Europe and the UK is showing signs of picking up. Surveys for June released this morning by the Confederation of British Industry and NTC Economics both indicate improvements.
The report from NTC is a new one. This compiler of global purchasing manager data began today to issue a "flash" estimate for the total Euro-Zone. It covers 85-90% of the full NTC panel in those countries, and for the period since its compilation, beginning January 2006, most components have run very close to their full-month counterparts. So here's an advance tool for assessing the condition of industry in Europe.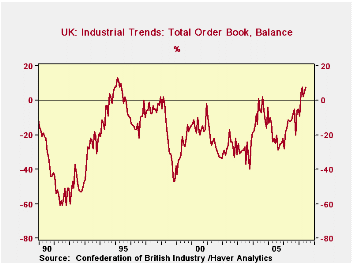
Numbers in this survey have not been weak, but they have edged gradually lower since the middle of last year. The overall index for manufacturing has run in the mid-50s, indicating net gains at slightly more than half of the responding firms. The gauge, though, has lost about 2-1/2 points since June 2006. In today's "Flash", it turned up modestly, only the fourth positive monthly move since that time. In the service sector, the peak was also in June 2006; the index lost several points almost immediately and has hovered in a narrow band since last August. So this month, the "Flash" for service sector "business activity" was up almost 1-1/2 points, putting it at the highest level since July 2006. In total, output in manufacturing and services combined, the so-called "composite output" index, rose just over 1 point in June. This index had dipped in April and May, so what we're noticing here as a welcome rebound may just be a reaction to those lower figures. We can only wait to see if this is a new trend or just a blip in an otherwise stagnating pattern. The final June data will be reported July 2 for manufacturing and July 4 for services and the composite figure.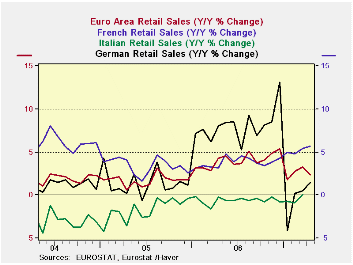
In this context of a hesitant upturn on the Continent, the UK's Confederation of British Industry survey looks that it might be providing corroborating evidence of improvement. Respondents' planned output over the coming 3 months has averaged +22 since February. This is the highest average over such a long period since mid-1995; the value for June alone was +25. More striking is the behavior of order books. These readings are generally well into negative territory, reaching as low as -48 in late 1998 and averaging lower than -20 for a whole year as recently as 2005 (-21). But this order book measure has been positive now also since February and in two of these months, March and June, it has been +8, the highest readings since May 1995.
We see in the final graph here that the movement in the CBI output series is not a bad indicator of actual industrial production. Indeed, the correlation of year-to-year % changes in total industrial production and the output measure itself is a substantial 67%. So it's worth paying attention to the favorable moves of these CBI measures in judging the condition of British industry, which just might be getting better.
The NTC-PMI data are in Haver's PMI database, and the CBI Industrial Trends Survey is in the UK database, as well as INTSRVYS.
| Business Surveys: UK & Euro-Zone | June 2007 | May 2007 | Apr 2007 | Year Ago | 2006 | 2005 | 2004 |
|---|---|---|---|---|---|---|---|
| CBI: Order Book | 8 | 5 | 2 | -12 | -13 | -21 | -9 |
| Output Next 3 Mos | 25 | 18 | 18 | 14 | 10 | 4 | 12 |
| Selling Prices, Next 3 Mos | 16 | 25 | 16 | 8 | 9 | 0 | 4 |
| Euro-Zone PMI Output "Flash"* | 57.66 | 56.62 | -- | -- | -- | -- | -- |
by Robert Brusca June 21, 2007
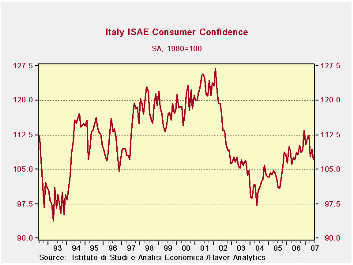
Italy’s consumer confidence fell off after peaking in February 2002. It bottomed in May 2004 and has been on a moderate rising trend ever since. But since March of 2007 a new down trend has developed.
The new weakness in Italy’s consumer confidence could be as simple as high oil prices. The recent surge in oil prices has become a problem for consumers around the world. But it could also have other factors at work. The responses to ISAE’s survey make me think that the latter broader scenario is the correct one.
Overall consumer confidence in Italy is 39% of its peak relative to its trough, a weak showing. However consumers do not assess the past 12-months harshly. Their rating leaves it in the 66th percentile of its historic range. The household financial situation during that period however sank to a range position just 17% form the bottom. As a result, consumers rate their current savings as the highest of the period as they seem to have reacted by ramping up savings and spending less than they might have been able to afford. Major purchases are rated in the bottom third of their range currently.
Ominously, for the period ahead, Italian consumers are very glum. They rate the overall conditions in the next 12 months in the bottom fifth of their range. Unemployment is rated in the top 20% of its range; consumers rate their own budget as the worst ever. They do not expect to be able to compensate and save as they rate future savings as in the bottom third of its range.
The responses from the Italian consumers are striking for their equanimity in assessing the past 12 months which then morphs into outright pessimism for the period ahead. Italy’s retail sales trends have reflected this sort of borderline angst for some time. Italy is of course one of the weaker large economies and seems to have trouble with its competitiveness. Italian industrial statistics including foreign orders have been afflicted with weakness, or at least a slowing trend. While unemployment has been dropping steadily in Italy it is clear that consumers do not extrapolate that success into the future. Is Italy alone in this, or is this sort of pessimism a harbinger of things to come in the rest of Europe?
| Since 1990 | ||||||||
| Jun-07 | May-07 | Apr-07 | 12-MO Avg | AVG | Max | Min | % Range | |
| CONSUMER CONFIDENCE | 107.2 | 109.4 | 107.8 | -110 | -112 | 128 | 94 | 39.5% |
| Last 12-Mos | ||||||||
| Overall Situation | -60 | -52 | -55 | 57 | 68 | -17 | -147 | 66.9% |
| Price Trends | -27.5 | -24.5 | -26.5 | 24 | 16 | 4 | -34 | 17.3% |
| HH Financial Situation | -40 | -35 | -38 | 36 | 27 | 0 | -49 | 18.4% |
| Current | ||||||||
| HH Savings** | 78 | 77 | 73 | -71 | -62 | 78 | 49 | 100.0% |
| Major Purchases** | 25.5 | 23.5 | 23 | -24 | -28 | 41 | 18 | 34.8% |
| Next 12 Months | ||||||||
| Overall Situation* | -22 | -18 | -17 | 17 | 11 | 24 | -34 | 20.7% |
| Prices Trends | 19 | 17.5 | 15.5 | -16 | -24 | 49 | 7 | 28.6% |
| Unemployment | 2 | -5 | -5 | 5 | 5 | 9 | -30 | 82.1% |
| Budget | -1 | 3 | 2 | -7 | -20 | 40 | -1 | 0.0% |
| Purchases planned** | 10.5 | 8.5 | 7.5 | -10 | -11 | 20 | 4 | 40.6% |
| Future | ||||||||
| **Savings | 26.5 | 26.5 | 23 | -27 | -34 | 43 | 20 | 29.8% |
| * Since Nov 1998, index is More +0.5 'Probable' or +0.5 'same' depending on category | ||||||||
by Robert Brusca June 21, 2007
With new figures on retail sales for France and Italy we have a better idea of emerging sales in the Euro area for Q2 2007. With one month’s data fully out the overall retail volume trend is advancing, even if it is weaker year-over-year. Euro area retail sales are up at a 3.4% pace annualized in the current quarter-to-date period (April/Q1). That’s a bit slower than the three-month annualized pace of 4.4%, but much faster than the Yr/Yr pace of 1.6% (2.4% for nonfood). France reported consumer spending for manufactured goods for May today and those figures (nominal) showed a drop for the second month in a row. Italy’s sales figures just announced for April (nominal) continue to show a picture of a struggling consumer. Italy’s nominal spending shows a drop in the current month.
While far from weak, the EMU trends are showing some softness as the second quarter gets underway. Manufacturing stats have also showed some off peak performance recently although the new NTC services indicators (PMIs) showed a rebound in today’s release. It is reasonable to question whether manufacturing and some of the foreign orders data are picking up signs of weakness relating to the strong euro. Are services doing relatively better because that sector is more insulated from trade impacts? Certainly EMU exports to the US have dropped off sharply this year. There may be something to the idea that the strong euro is finally taking some toll and consumers can feel it even though the service sector is not yet showing it. Consumer spending patterns do seem to be a bit more erratic – except, of course, in the UK where the MPC is at odds with itself over whether to hike rates again or not.
Germany’s retail trends are still a bit hard to untangle due to the VAT hike that disrupted late 2006 and early 2007 spending. The UK is showing a strong trend in spending and so is France, but the French trend may be in jeopardy due to the slide in spending on manufactured goods by consumers.
The category data for the Euro area is a bit uneven in terms of its timeliness. But we can see that through April the 3-month trends are on an upswing for the total and for the total excluding food. Through March (the shaded area of the table) a slowing in the most recent period is indicated for a broad class of consumer goods, at least in the recent three month period.
The country-level data are quite strong, at least for the large EMU/EU countries. So far it is hard to build a case for encroaching weakness but some signs that growth may be topping permeate the various reports. It’s a good time to watch these reports very closely and to pay attention to revisions.
| Apr-07 | Mar-07 | Feb-07 | 3-Month | 6-Month | 12-Month | |
| Euro area 13 Total | 0.1% | 0.5% | 0.5% | 4.4% | 1.8% | 1.6% |
| Food | 0.4% | 0.4% | 0.3% | 4.5% | 1.8% | 0.9% |
| Nonfood | 0.0% | 0.5% | 0.8% | 5.0% | 2.1% | 2.4% |
| Textiles | #N/A | 0.2% | 1.2% | 2.4% | 7.6% | 6.1% |
| HH goods | #N/A | 1.1% | 0.4% | -5.1% | 2.8% | 5.1% |
| Books news | #N/A | 0.9% | 0.3% | 1.1% | 2.4% | 2.9% |
| Pharmaceutical | #N/A | 0.4% | 0.5% | 1.3% | 3.7% | 3.4% |
| Other Nonspecialized | -0.4% | 0.8% | 1.2% | 0.0% | 1.2% | 2.4% |
| Mail Order | 1.4% | -1.8% | 3.0% | -17.5% | 2.2% | -0.2% |
| Nonfood Country detail: Volume | ||||||
| Germany | 2.1% | 0.0% | 3.5% | 24.9% | 0.8% | 1.4% |
| France | 0.7% | 0.8% | 0.3% | 7.4% | 6.6% | 5.7% |
| Italy (Total Value) | #N/A | 0.2% | -0.1% | -0.4% | -0.5% | 0.1% |
| UK (EU) | -0.1% | 0.7% | 1.7% | 9.8% | 6.7% | 5.9% |
| Shaded areas calculated on a one-month lag due to lagging data. | ||||||
| The Euro area 13 countries are Austria, Belgium, Finland, France, Germany, Greece, Ireland, Italy, Luxembourg, the Netherlands, Portugal, Slovenia and Spain. | ||||||
by Tom Moeller June 21, 2007
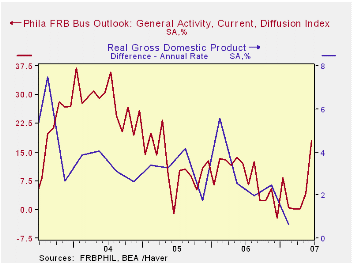
The General Activity Index published by the Federal Reserve Bank of Philadelphia improved sharply this month to 18.0 versus a May reading of 4.2.
The average level of the index during the second quarter also improved to 7.5, the highest level in a year.
During the last twenty years there has been a 57% correlation between the level of the Philadelphia Fed Index and the quarterly change in real GDP. 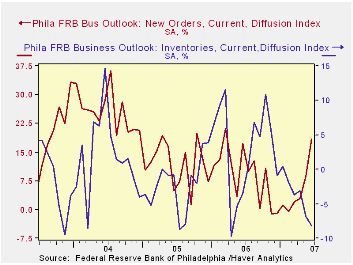
Improvement in the index of general business conditions was led by higher new orders and higher unfilled orders. The number of employees fell month to month after improvement in May while inventories fell sharply.
The index of prices paid fell modestly after sharp gains during the prior four months. For 2Q the index of prices paid was at its highest in nearly one year but the index of prices received fell.Inflation Disconnect from the Federal Reserve Bank of St. Louis can be found here.
| St Louis Fed | June | May | June '06 | 2006 | 2005 | 2004 |
|---|---|---|---|---|---|---|
| General Business Conditions | 18.0 | 4.2 | 0.48 | 8.1 | 11.5 | 181 |

Tom Moeller
AuthorMore in Author Profile »Prior to joining Haver Analytics in 2000, Mr. Moeller worked as the Economist at Chancellor Capital Management from 1985 to 1999. There, he developed comprehensive economic forecasts and interpreted economic data for equity and fixed income portfolio managers. Also at Chancellor, Mr. Moeller worked as an equity analyst and was responsible for researching and rating companies in the economically sensitive automobile and housing industries for investment in Chancellor’s equity portfolio. Prior to joining Chancellor, Mr. Moeller was an Economist at Citibank from 1979 to 1984. He also analyzed pricing behavior in the metals industry for the Council on Wage and Price Stability in Washington, D.C. In 1999, Mr. Moeller received the award for most accurate forecast from the Forecasters' Club of New York. From 1990 to 1992 he was President of the New York Association for Business Economists. Mr. Moeller earned an M.B.A. in Finance from Fordham University, where he graduated in 1987. He holds a Bachelor of Arts in Economics from George Washington University.
More Economy in Brief