 Global| Mar 10 2005
Households' Net Worth A Record in 4Q04, But Not Versus Income
by:Tom Moeller
|in:Economy in Brief
Summary
The net worth of the US household sector rose 8.8% last quarter versus 4Q03 to a record $48.5 trillion. The gain failed, however, to lift net worth to a new high versus income. In fact the increase lagged the 12.5% rise in net worth [...]
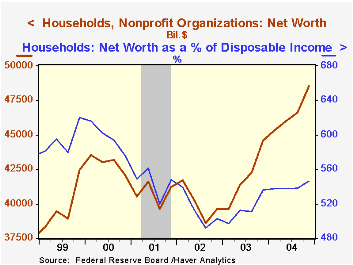
The net worth of the US household sector rose 8.8% last quarter versus 4Q03 to a record $48.5 trillion. The gain failed, however, to lift net worth to a new high versus income. In fact the increase lagged the 12.5% rise in net worth during 2003 and the ratio versus disposable income rose only slightly y/y to 5.5 times versus a peak of 6.2 times in 1999.
Household sector asset values rose 9.4% y/y as the value of real estate holdings jumped 12.9%. Financial asset values rose 7.8%, half the gain in 2003 and held back by higher interest rates which reduced the growth in treasury issues to 0.6%. Money market share values fell 9.3% but foreign deposits, checkable deposits and time & savings deposits all soared. Higher prices in the stock market helped lift the value of mutual fund shares by 18.7% and the value of corporate equities held directly rose 2.3%.
Foreign sector holdings of total US assets rose 20.7% y/y raising the foreign sector's ownership share of total US financial assets to a record 12.7% versus 7.0% ten years ago.
Growth in total credit market debt outstanding was steady at 8.2% y/y. The federal government and US households continued growing debt at or about a double digit rate and nonfinancial corporations' debt grew a lesser 4.8% y/y though it sped up in 4Q.
Individuals' total liabilities rose 10.7% last year, the fastest since 2000, as mortgage debt grew 13.6% and consumer credit rose 4.9%.
| Flow of Funds | % of Total | 4Q04 (%, AR) |
3Q04 (%, AR) |
2004 (%, Y/Y) |
2003 (%, Y/Y) |
2002 (%, Y/Y) |
|---|---|---|---|---|---|---|
| Total Credit Market Debt Outstanding | 9.8% | 8.9% | 8.2% | 8.8% | 7.5% | |
| Federal Government | 12% | 9.9% | 8.2% | 9.0% | 10.9% | 7.6% |
| Households | 28% | 11.7% | 14.0% | 11.2% | 10.3% | 9.6% |
| Nonfinancial Corporate Business | 14% | 9.2% | 4.8% | 4.8% | 3.5% | 0.6% |
| Financial Sectors | 33% | 7.9% | 7.6% | 7.3% | 10.4% | 9.3% |
| Total Credit Market Assets | 9.8% | 8.9% | 8.2% | 8.8% | 7.5% | |
| Household Sector | 6% | 9.8% | 11.7% | 1.0% | 8.1% | -4.7% |
| Rest of World | 13% | 21.5% | 14.9% | 20.7% | 14.8% | 16.4% |
| US Financial Sectors | 76% | 8.1% | 7.9% | 7.1% | 8.2% | 7.8% |
| Net Worth: Households & Nonprofit Organizations (Trillions) | $48.5 | $46.6 | $48.5 | $44.6 | $39.6 | |
| Tangible Assets | $22.5 | $22.0 | $22.5 | $20.1 | $18.4 |
by Tom Moeller March 10, 2005
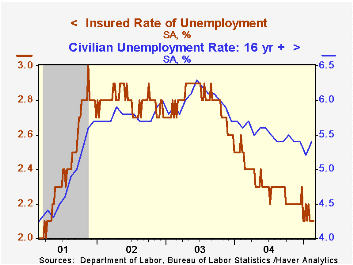
Initial claims for unemployment insurance rose 17,000 to 327,000 last week from an unrevised level the prior week. Consensus expectations had been for 310,000 claims. Claims may have reflected a rebound from the holiday shortened period the week prior.
The four week moving average of initial claims rose to 312,500 (-9.7% y/y).
Continuing claims for unemployment insurance rose 39,000 and the insured rate of unemployment remained at 2.1%.
During the last ten years there has been a (negative) 75% correlation between the level of initial claims for unemployment insurance and the monthly change in payroll employment. There has been a (negative) 66% correlation with the level of continuing claims.
The latest beige book from The Federal Reserve Board can be found here.
| Unemployment Insurance (000s) | 03/05/05 | 02/26/05 | Y/Y | 2004 | 2003 | 2002 |
|---|---|---|---|---|---|---|
| Initial Claims | 327 | 310 | -4.1% | 343 | 402 | 404 |
| Continuing Claims | -- | 2,703 | -11.6% | 2,926 | 3,531 | 3,570 |
by Carol Stone March 10, 2005
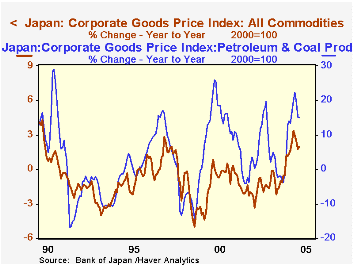
In recent years, when we think of Japan's economy, we almost immediately think of deflation. But some prices have been turning around over the last several months, possibly bringing to a conclusion this unpleasant episode. Today in Tokyo, the Bank of Japan reported its February corporate goods price index (CGPI). This broad wholesale price index is a measure of average business transaction prices among domestic, export and import goods. Its 12-month percent change turned positive last May after almost exactly three years of persistent decline. The index reached a recent peak of 3.4% inflation in October and has actually settled back somewhat since then, rising 2.5% across 2004 as a whole and up 2.0% in these latest February figures.
"Oh, the recent strength is just an oil-price phenomenon," you might argue, and indeed, the total index did move into positive territory soon after key world oil prices began to move strongly higher. But year-to-year inflation in petroleum has only a 52% correlation with the manufacturing subset of these prices. So clearly, more is at work here. Other world commodity prices play a role, particularly for metals. As seen in the second graph, the nonferrous metals component of the CGPI moves similarly with the price of copper on the London Metals Exchange; the correlation over the last 15 years has been a substantial 76%. The iron and steel component of CGPI has a 73% correlation with the analogous component of producer prices in the Euro-Zone. So several raw materials are pushing up overall wholesale prices.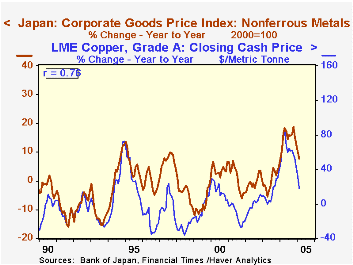
Among processed and finished goods, 12-month price changes are positive for such diverse segments as ceramic products and general machinery, besides petroleum-related items including chemicals and plastics. Intermediate goods prices are positive overall, while total "final goods" price changes remain in negative territory, particularly for consumer goods.
The generally firming prices are at once a help and a hindrance to Japanese industry. The higher materials costs are burdensome unless they can be passed along. But what we seem to be seeing here is a gradual push of these costs through the production chain, hinting that some support to final demand pricing may be developing. While still showing deflation, the erosion in final goods prices has diminished somewhat.
| Japan 12-Month % Changes |
Feb 2005 | Jan 2005 | December/December|||
|---|---|---|---|---|---|
| 2004 | 2003 | 2002 | |||
| Total CGPI | 2.0 | 1.8 | 2.5 | -1.6 | -1.3 |
| Manufacturing | 1.6 | 1.7 | 2.3 | -2.1 | -1.6 |
| Petroleum & Coal Products | 14.9 | 15.2 | 20.2 | -2.1 | 12.5 |
| Raw Materials | 11.2 | 8.6 | 10.9 | 2.0 | 7.5 |
| Intermediate Goods | 3.7 | 4.0 | 4.7 | -0.1 | -0.6 |
| Final Goods | -1.5 | -1.9 | -1.5 | -1.8 | -2.6 |

Tom Moeller
AuthorMore in Author Profile »Prior to joining Haver Analytics in 2000, Mr. Moeller worked as the Economist at Chancellor Capital Management from 1985 to 1999. There, he developed comprehensive economic forecasts and interpreted economic data for equity and fixed income portfolio managers. Also at Chancellor, Mr. Moeller worked as an equity analyst and was responsible for researching and rating companies in the economically sensitive automobile and housing industries for investment in Chancellor’s equity portfolio. Prior to joining Chancellor, Mr. Moeller was an Economist at Citibank from 1979 to 1984. He also analyzed pricing behavior in the metals industry for the Council on Wage and Price Stability in Washington, D.C. In 1999, Mr. Moeller received the award for most accurate forecast from the Forecasters' Club of New York. From 1990 to 1992 he was President of the New York Association for Business Economists. Mr. Moeller earned an M.B.A. in Finance from Fordham University, where he graduated in 1987. He holds a Bachelor of Arts in Economics from George Washington University.
More Economy in Brief


