 Global| Dec 03 2002
Home Price Data Diverge
by:Tom Moeller
|in:Economy in Brief
Summary
Prices for existing homes rose last quarter by the smallest degree in nearly five years. With the exception of a 0.8% gain in 4Q 01, prices have risen between one and three percent each quarter since 1998 according to the government's [...]
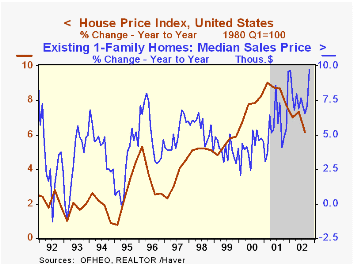
Prices for existing homes rose last quarter by the smallest degree in nearly five years. With the exception of a 0.8% gain in 4Q 01, prices have risen between one and three percent each quarter since 1998 according to the government's Office of Federal Housing Enterprise Oversight.
The data cover only home mortgages repurchased by Fannie Mae and Freddie Mac and therefore do not cover high priced homes with mortgages over roughly $300,000 (roughly 25% of the market).
The data correct for "mix shifts", i.e., changes in home quality, size and location.
Prices of existing homes as published by the National Association of Realtors rose 2.3% last quarter. Year to year, the Realtors' price series rose 6.9% versus a 6.2% gain in the Government series. A strong gain in October home prices lifted the Y/Y comparison in the Realtors' price series to 9.8%.
| House Price Index | 3Q 02 | 2Q 02 | Y/Y | 2001 | 2000 | 1999 |
|---|---|---|---|---|---|---|
| US Total, Q/Q % | 0.8% | 2.4% | 6.2% | 8.5% | 7.7% | 5.5% |
by Tom Moeller December 3, 2002
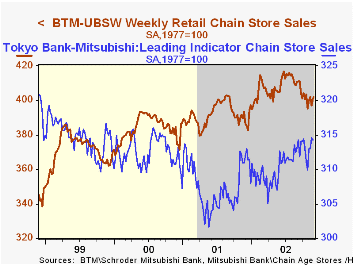
Chain store sales rose 0.3% last week according to the BTM-UBSW survey. The rise during Thanksgiving week was somewhat less ebullient than earlier reports from individual stores of holiday sales. The gain followed a 0.9% rise in sales the prior week.
Sales for the month of November were down 0.2% from the average level of October. October sales fell 1.5% from September.
Month to month comparisons, and certainly year to year comparisons, are difficult due to the late timing of Thanksgiving this year.
During the last ten years there has been a 48% correlation between the year-to-year percent change in monthly chain store sales and the change in GAF retail sales. That correlation rose to 63% during the last five years.
| BTM-UBSW (SA, 1977=100) | 11/30/02 | 11/23/02 | Y/Y | 2001 | 2000 | 1999 |
|---|---|---|---|---|---|---|
| Total Weekly Retail Chain Store Sales | 402.0 | 400.8 | 4.0% | 2.1% | 3.4% | 6.7% |
by Tom Moeller December 3, 2002
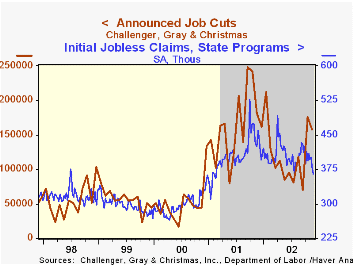
According to Challenger, Gray & Christmas, announced job cuts remained high last month. The level of layoffs did fall 10.5% versus October, but layoffs during that month had more than doubled
The three month moving average of job cut announcements rose again to 134,525. That level was down 39.9% versus the high of late last year.
Lower announced job cuts were notable in the consumer goods, utility, retail, automotive and commodities industries. Layoff announcements rose broadly amongst other industries.
| Challenger, Gray & Christmas | Nov | Oct | Y/Y | 2001 | 2000 |
|---|---|---|---|---|---|
| Announced Job Cuts | 157,508 | 176,010 | -13.2% | 1,956,876 | 613,980 |
by Tom Moeller December 3, 2002
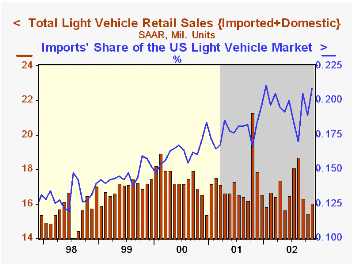
Unit sales of light vehicles rose in November for the first month in three, up a modest 3.8% versus October. Sales were down 10.0% from last November. Sales were better than Consensus expectations for a 15.8M unit sales rate.
Sales through the first eleven months have averaged 16.64 mil. units, down 4% from the first eleven months of 2001.
Sales of domestically built vehicles rose 1.3% m/m following two months of decline. Auto sales rose 4.9% but sales of light trucks fell 1.4%.
Imported vehicle sales rose 14.7%, recouping nearly all of a sharp October decline. Imported auto sales rose 17.1% and truck sales rose 9.9%.
Imports' share of the US light vehicle market surged to 20.9%, the highest monthly share for imports since a record 21.1% share this past January. Imports' share of the US vehicle market year to date has averaged 19.6% versus 17.8% during all of last year.
| Light Vehicle Sales (SAAR, Mil.Units) | Nov | Oct | Y/Y | 2001 | 2000 | 1999 |
|---|---|---|---|---|---|---|
| Total | 16.04 | 15.45 | -10.0% | 17.27 | 17.40 | 16.95 |
| Domestic | 12.69 | 12.53 | -12.8% | 14.20 | 14.58 | 14.47 |
| Imported | 3.35 | 2.92 | 2.3% | 3.07 | 2.82 | 2.48 |

Tom Moeller
AuthorMore in Author Profile »Prior to joining Haver Analytics in 2000, Mr. Moeller worked as the Economist at Chancellor Capital Management from 1985 to 1999. There, he developed comprehensive economic forecasts and interpreted economic data for equity and fixed income portfolio managers. Also at Chancellor, Mr. Moeller worked as an equity analyst and was responsible for researching and rating companies in the economically sensitive automobile and housing industries for investment in Chancellor’s equity portfolio. Prior to joining Chancellor, Mr. Moeller was an Economist at Citibank from 1979 to 1984. He also analyzed pricing behavior in the metals industry for the Council on Wage and Price Stability in Washington, D.C. In 1999, Mr. Moeller received the award for most accurate forecast from the Forecasters' Club of New York. From 1990 to 1992 he was President of the New York Association for Business Economists. Mr. Moeller earned an M.B.A. in Finance from Fordham University, where he graduated in 1987. He holds a Bachelor of Arts in Economics from George Washington University.
More Economy in Brief


