 Global| Mar 18 2009
Higher Energy Prices Lift U.S. CPIBy Most Since July; Core Pricing Power Firm
by:Tom Moeller
|in:Economy in Brief
Summary
Last year's sharp decline in energy prices came to an abrupt end with the turn of the calendar page to 2009; and the consumer price index published by the Bureau of Labor Statistics (along with consumers' wallets) noted the shift. [...]
 Last
year's sharp decline in energy prices came to an abrupt end with the
turn of the calendar page to 2009; and the consumer price index
published by the Bureau of Labor Statistics (along with consumers'
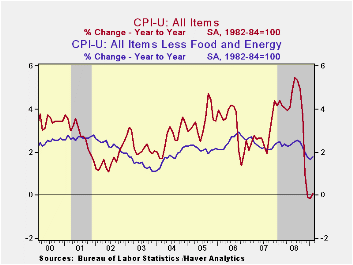
wallets) noted the shift. During February, the CPI rose for only the
second time since July. The 0.4% increase followed an unrevised 0.3%
January gain as a 3.3% rise in energy prices roughly doubled their
January increase. The latest increase in the CPI slightly
outpaced Consensus expectations for a 0.3% rise.
Last
year's sharp decline in energy prices came to an abrupt end with the
turn of the calendar page to 2009; and the consumer price index
published by the Bureau of Labor Statistics (along with consumers'
wallets) noted the shift. During February, the CPI rose for only the
second time since July. The 0.4% increase followed an unrevised 0.3%
January gain as a 3.3% rise in energy prices roughly doubled their
January increase. The latest increase in the CPI slightly
outpaced Consensus expectations for a 0.3% rise.
The increase in energy prices reflected higher gasoline prices which jumped by 8.3% following the 6.0% January rise. Despite these gains, however, prices are more than one-third lower versus last February. This month gasoline prices have held the higher February level of $1.92 per gallon of regular but this week have moved even higher. Offsetting some of that upward pressure have been lower fuel oil prices. They fell 1.8% last month (-21.4% y/y) and have fallen in each month since July. Similarly, prices for natural gas & electricity have fallen in all but one of the last seven months though they still are 5.7% higher than last February.
Some of that upward pressure has been relieved by a
moderation in food & beverage price increases. 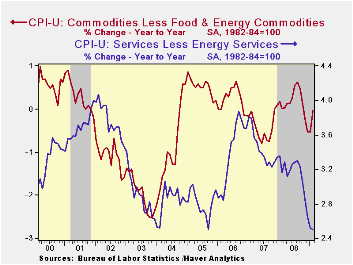 Prices actually
slipped 0.1% last month after 0.1% upticks during January and
December. Nevertheless, food prices still are a firm 4.7% higher than
last year but that's versus a 6.3% comparison this past fall. Recent
weakness has been led by lower dairy product prices (-1.7% y/y) and
five consecutive months of slight decline in meat and dairy product
prices (+4.2% y/y).
Prices actually
slipped 0.1% last month after 0.1% upticks during January and
December. Nevertheless, food prices still are a firm 4.7% higher than
last year but that's versus a 6.3% comparison this past fall. Recent
weakness has been led by lower dairy product prices (-1.7% y/y) and
five consecutive months of slight decline in meat and dairy product
prices (+4.2% y/y).
Core prices (CPI less food and energy) rose for the second month by 0.2%. Those gains were the strongest since August and moved the year-to-year increase up slightly to 1.8%.
Core goods prices increased a firm 0.4% and that was enough to lift the three-month change to 1.2% (AR), its highest since last August. Prices of new & used motor vehicles rose 0.5% (-2.5% y/y) while apparel prices jumped 1.3% (0.8% y/y). Prices for household furnishings & operations firmed by 0.2% after the slight January decline and the y/y change remained healthy at 1.9%. Tobacco prices again were quite strong and rose 0.7% to leave them up 6.3% y/y.
Gains in core services prices moderated
even further and posted a 0.1% uptick. The three-month rate of increase
remained a low at 1.6% (AR) after growing at a 3.9% rate this past
summer. That moderation owes mostly to weakness in the housing market
which caused February shelter prices to fall slightly. That was enough
to pull the three-month change down to 0.7%. Owners equivalent rent of
primary residence, a measure not equivalent to other house price
measures, ticked up 0.1% (2.1% y/y). 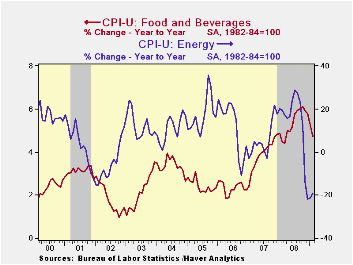 The increase in medical care
services prices fell back to 0.3% (3.1% y/y) while education costs rose
a moderate 0.4% (5.5% y/y). Public transportation prices fell
hard like they did during the prior month by 1.9%. They were down for
the sixth consecutive period (-1.8% y/y). The increase in recreation
prices held firm at 0.4% (1.9% y/y). v The chained CPI, which adjusts
for shifts in consumption patterns, rose 0.6%, about as it did during
January. Less food and energy, chained prices firmed even more and
doubled the January increase of 0.2%.
The increase in medical care
services prices fell back to 0.3% (3.1% y/y) while education costs rose
a moderate 0.4% (5.5% y/y). Public transportation prices fell
hard like they did during the prior month by 1.9%. They were down for
the sixth consecutive period (-1.8% y/y). The increase in recreation
prices held firm at 0.4% (1.9% y/y). v The chained CPI, which adjusts
for shifts in consumption patterns, rose 0.6%, about as it did during
January. Less food and energy, chained prices firmed even more and
doubled the January increase of 0.2%.
The consumer price data is available in Haver's USECON database while detailed figures can be found in the CPIDATA database.
The Impact of Credit Easing So Far from the Federal Reserve Bank of Cleveland is available here.
| Consumer Price Index (%) | February | January | Y/Y | 2008 | 2007 | 2006 |
|---|---|---|---|---|---|---|
| Total | 0.4 | 0.3 | 0.1 | 3.8 | 2.9 | 3.2 |
| Total less Food & Energy | 0.2 | 0.2 | 1.8 | 2.3 | 2.3 | 2.5 |
| Goods less Food & Energy | 0.4 | 0.1 | -0.0 | 0.1 | -0.4 | 0.2 |
| Services less Energy | 0.1 | 0.2 | 2.5 | 3.1 | 3.4 | 3.4 |
| Energy | 3.3 | 1.7 | -19.1 | 13.5 | 5.7 | 11.0 |
| Food & Beverages | -0.1 | 0.1 | 4.7 | 5.4 | 3.9 | 2.3 |
| Chained CPI: Total (NSA) | 0.6 | 0.5 | -0.3 | 3.3 | 2.5 | 2.9 |
| Total less Food & Energy | 0.4 | 0.2 | 1.3 | 2.0 | 2.0 | 2.2 |
by Tom Moeller March 18, 2009
 In an anticipated move the
Federal Open Market Committee today
left the Federal funds rate in a "range from 0 to 1/4
percent." The discount also was left unchanged at
0.50%. The Fed funds rate remained the lowest ever.
In an anticipated move the
Federal Open Market Committee today
left the Federal funds rate in a "range from 0 to 1/4
percent." The discount also was left unchanged at
0.50%. The Fed funds rate remained the lowest ever.
Regarding economic liquidity, the Fed focused on the housing market indicating that "To provide greater support to mortgage lending and housing markets, the Committee decided today to increase the size of the Federal Reserve’s balance sheet further by purchasing up to an additional $750 billion of agency mortgage-backed securities, bringing its total purchases of these securities to up to $1.25 trillion this year, and to increase its purchases of agency debt this year by up to $100 billion to a total of up to $200 billion." Additional action to provide liquidity also was taken.
Regarding economic growth, the Fed indicated that "that the
economy continues to contract. Job losses, declining equity
and housing wealth, and tight credit conditions have weighed on
consumer sentiment and spending. Weaker sales prospects and
difficulties in obtaining credit have led businesses to cut back on
inventories and fixed investment."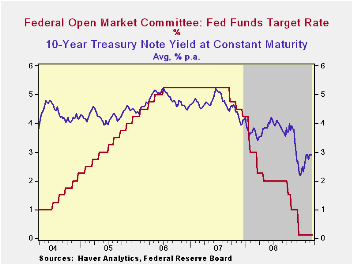
"... the Committee anticipates that policy actions to stabilize financial markets and institutions, together with fiscal and monetary stimulus, will contribute to a gradual resumption of sustainable economic growth."
Regarding inflation the same statement was offered as at the last meeting. "... that inflation will remain subdued. Moreover, the Committee sees some risk that inflation could persist for a time below rates that best foster economic growth and price stability in the longer term.
The decision was unanimous amongst FOMC voters.
For the complete text of the Fed's latest press release please follow this link.
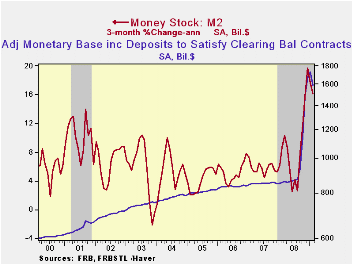
The Fed's effort to liquefy the economic system has
succeeded. Growth in the money supply measure M2 has been
running at double-digit rates versus five-to-six percent from 2006 and
during all of 2008. Over the last three months growth in MZM
(M2 less time deposits, plus all money market funds) has been 22%
versus 14% during all of last year and 9% during 2007. 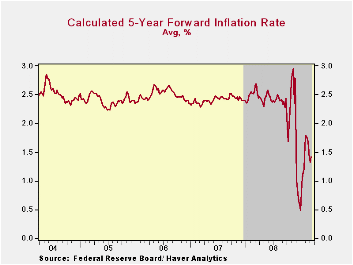 Growth
in the monetary base ran at a 32% annual rate from November to March
after the level of the base doubled last autumn. This year,
the bond market has met these liquidity injections with uncertainty but
on balance has been not overly concerned about the eventual
inflationary consequences.
Growth
in the monetary base ran at a 32% annual rate from November to March
after the level of the base doubled last autumn. This year,
the bond market has met these liquidity injections with uncertainty but
on balance has been not overly concerned about the eventual
inflationary consequences.
The Haver databases USECON, WEEKLY and DAILY contain the figures from the Federal Reserve Board.
Credit and Liquidity Programs and the Balance Sheet from the Federal Reserve Board is available here.
G-20 Asks IMF to Track, Assess Global Crisis Response is a recent article published in the IMF Survey Magazine: In the News and it can be found here.
| Current | Last | December | 2008 | 2007 | 2006 | |
|---|---|---|---|---|---|---|
| Federal Funds Rate, % (Target) | 0.00 - 0.25 | 0.00 - 0.25 | 0.16 | 1.93 | 5.02 | 4.96 |
| Discount Rate, % | 0.50 | 0.50 | 0.50 | 2.39 | 5.86 | 5.96 |
by Robert Brusca March 18, 2009
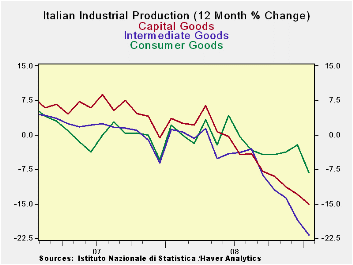
Italy’s industrial production (IP) dropped again in January
but the decline was puny in comparison with the recent string of
monthly disasters. This month’s drop of 0.2% keeps the string of
declines alive but, ironically, gives some room for hope to come alive
that these declines will not go on forever.
The declines in the quarter–to-date are still quite severe –
despite the small drop in January. That’s because the level of
industrial activity at the end of the quarter in Q4-2008 is so low that
the first month of 2009 leaves the early quarter reading at a very low
level compared to the Q4 2008 average level.
All the main sectors industrial sectors have been showing
strong declines. Italy’s GDP has been dropping and its neighbors in the
Euro Area are experiencing continuing weakness. It is far too early to
treat the smaller IP decline in Italy as the beginning of good news on
the industrial front. The news is welcome but the good news is the
first such news and appears totally out of context and so far without
support elsewhere. Generally this is not the sector where you expect to
see good new appear first.
| Italy IP Excluding Construction | |||||||
|---|---|---|---|---|---|---|---|
| Saar except m/m | Jan-09 | Dec-08 | Nov-08 | 3-mo | 6-mo | 12-mo | Quarter-to-date |
| IP-MFG | -0.2% | -2.7% | -3.2% | -21.9% | -20.7% | -14.6% | -17.2% |
| Consumer Goods | -1.7% | -0.9% | 0.4% | -8.5% | -8.4% | -8.2% | -12.3% |
| Capital Goods | 0.5% | -3.5% | -2.9% | -21.3% | -19.5% | -15.0% | -15.9% |
| Intermediate Goods | -2.0% | -4.7% | -3.5% | -33.9% | -30.9% | -21.8% | -32.2% |

Tom Moeller
AuthorMore in Author Profile »Prior to joining Haver Analytics in 2000, Mr. Moeller worked as the Economist at Chancellor Capital Management from 1985 to 1999. There, he developed comprehensive economic forecasts and interpreted economic data for equity and fixed income portfolio managers. Also at Chancellor, Mr. Moeller worked as an equity analyst and was responsible for researching and rating companies in the economically sensitive automobile and housing industries for investment in Chancellor’s equity portfolio. Prior to joining Chancellor, Mr. Moeller was an Economist at Citibank from 1979 to 1984. He also analyzed pricing behavior in the metals industry for the Council on Wage and Price Stability in Washington, D.C. In 1999, Mr. Moeller received the award for most accurate forecast from the Forecasters' Club of New York. From 1990 to 1992 he was President of the New York Association for Business Economists. Mr. Moeller earned an M.B.A. in Finance from Fordham University, where he graduated in 1987. He holds a Bachelor of Arts in Economics from George Washington University.
More Economy in Brief


