 Global| Aug 22 2006
"For the CPI excluding everything, inflation is zero."ĀĀ
by:Tom Moeller
|in:Economy in Brief
Summary
The above quote from a wise bond trader has been voiced for years by skeptics who wonder why anything as important as the price for energy, food, etc. should be taken out of an inflation measure. The short answer is that some supply [...]
The above quote from a wise bond trader has been voiced for years by skeptics who wonder why anything as important as the price for energy, food, etc. should be taken out of an inflation measure.
The short answer is that some supply shocks will be short lived. The "core" inflation rate is the rate which will be returned to.
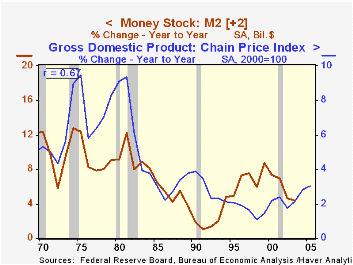
The risk is of this analysis is that it misses two important definitions of the future rate of price inflation. 1) Inflation is governed by the growth of money (demand). 2) Inflation results from too much money chasing too few goods.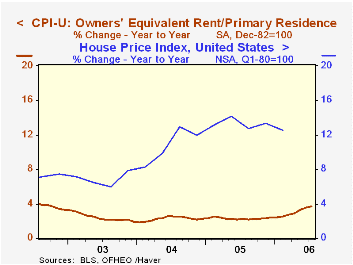
Since 1970 there has been a 67% correlation between the annual growth in the money supply (M2) and the growth in the GDP price deflator two years later.
Inflationary expectations will embody all of the forces that are affecting prices. So while it may be valid to exclude some short term price spike, the calculation misses the lingering effect of how those higher prices affect psychology. And there's always the possibility of some "policy mistake." During the 1970s, it was argued that the wealth lost (to OPEC) due to the quadrupling of oil prices needed to be replaced. Money growth was ramped up, and we learned how inflation could be "monetized."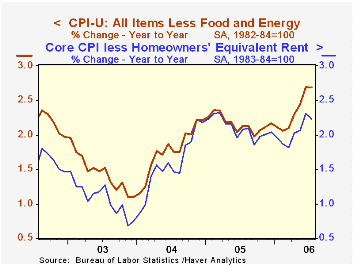
The inflation in home prices certainly is an area for study. The price measure of a "constant quality" house published by the Office of Federal Housing Enterprise Oversight (OFFEO) indicated that through the first quarter, home prices rose 12.5% y/y. The consumer price index rental equivalence, however, indicated only a 2.6% gain though that did accelerate last quarter to 3.3%.
Click here for a discussion of Owners Equivalent Rent and the Cost of Living by Federal Reserve Bank of New York economist Charles Steindel. This paper was presented at the Annual Meeting of the National Association for Business Economics (www.nabe.com) and later published in the January 2006 issue of the NABE journal Business Economics.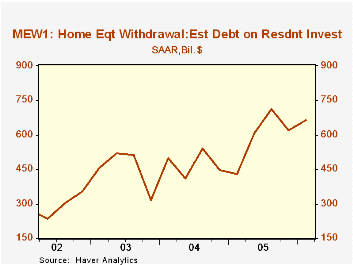
Indeed, the "core" rate of Consumer Price Inflation of 2.7% in July was higher than the 2.2% gain in the measure less homeowners equivalent rent. The divergence certainly would have been higher if the price appreciation in the OFFEO measure were fully reflected in the CPI, but ...
The core issue (pardon the pun) is whether home price inflation, however measured, is impacting the prices of other goods and services. Mortgage Equity Withdrawal (MEW) is a measure available in the Mortgage Market section of Haver's USECON database and it provides an indication of how money balances (demand) are being impacted by home price inflation.
Estimates of home mortgage originations, repayments, and debt on one-to-four-family residences from the Board of Governors of the Federal Reserve System can be found here.
Reflections on Four Decades of Central Banking, today's speech by Atlanta Fed President Jack Guynn, can be found here.
| Consumer Price Index | July | June | Y/Y | 2005 | 2004 | 2003 |
|---|---|---|---|---|---|---|
| Total | 0.4% | 0.2% | 4.2% | 3.4% | 2.7% | 2.3% |
| Less Homeowners' Rent | 0.5% | 0.1% | 4.3% | 3.7% | 2.8% | 2.2% |
| Total less Food & Energy | 0.2% | 0.3% | 2.7% | 2.2% | 1.8% | 1.5% |
| Less Homeowners' Rent | 0.1% | 0.2% | 2.2% | 2.1% | 1.6% | 1.1% |
by Tom Moeller August 22, 2006
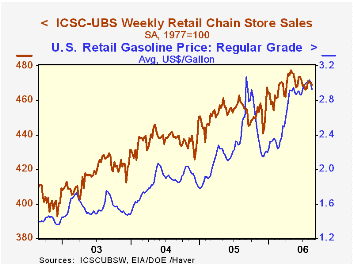
Last week, chain store sales slipped 0.2% again. The decline was the third consecutive week of lackluster sales, according to the International Council of Shopping Centers (ICSC)-UBS survey, and lowered the latest week's total 0.4% below the end of July.
Sales in August on average are 0.3% above July due to a strong gain at the end of last month. During the last ten years there has been a 47% correlation between the y/y change in chain store sales and the change in nonauto retail sales less gasoline.The ICSC-UBS retail chain-store sales index is constructed using the same-store sales (stores open for one year) reported by 78 stores of seven retailers: Dayton Hudson, Federated, Kmart, May, J.C. Penney, Sears and Wal-Mart.
The leading indicator of chain store sales from ICSC-UBS was unchanged (-2.3% y/y) in the latest week after several weeks of decline. Retail gasoline prices fell for the second consecutive week. The eight cent decline to an average $2.92 (+11.9% y/y) for regular unleaded gas compared to a July average of $2.98. In spot market trading yesterday, regular unleaded gasoline prices dropped sharply $1.78, down 60 cents from the daily high reached late last month.The latest Short-Term Energy Outlook from the U.S. Energy Information Administration is available here.
| ICSC-UBS (SA, 1977=100) | 08/19/06 | 08/12/06 | Y/Y | 2005 | 2004 | 2003 |
|---|---|---|---|---|---|---|
| Total Weekly Chain Store Sales | 469.1 | 470.1 | 2.7% | 3.6% | 4.7% | 2.9% |
by Louise Curley August 22, 2006
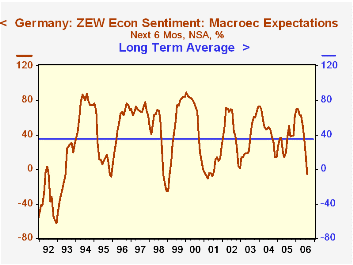
Confidence among the German investors and analysts who participate in the ZEW survey, deteriorated sharply in August. Those expecting economic conditions to worsen six months from now outnumbered those expecting improvement by 5.6% in contrast to July when the optimists outnumbered the pessimists by 15.1%. The decline in sentiment was not only greater than the consensus had expected, but has brought confidence to a level well below the long term average (35%) as can be seen in the first chart.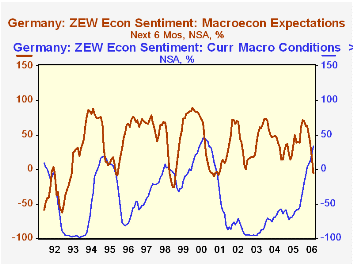
While becoming more pessimistic about the outlook, these same investors and analysts continue to view current conditions more favorably. In August, those viewing current conditions as "good" outnumbered those viewing current conditions as "bad" by 33.6% versus 23.3% in July. July was the first month since early 2001 in which the appraisal of current conditions was better than that of expectations. In general the investors and analysts tend to be more optimistic about the future than they are about present conditions as can be seen in the second chart.
| Germany: ZEW Survey of Investors and Analysts | Aug 06 | Jul 06 | Aug 05 | M/M Dif | Y/Y Dif | 2005 | 2004 | 2003 |
|---|---|---|---|---|---|---|---|---|
| Current Conditions (% balance) | 33.6 | 23.3 | -61.1 | 10.3 | 94.7 | -61.8 | -67.7 | -97.6 |
| Expectations of Conditions 6 Months Ahead (% balance) | -5.6 | 15.1 | 50.0 | -20.7 | -55.6 | 34.8 | 44.6 | 38.4 |

Tom Moeller
AuthorMore in Author Profile »Prior to joining Haver Analytics in 2000, Mr. Moeller worked as the Economist at Chancellor Capital Management from 1985 to 1999. There, he developed comprehensive economic forecasts and interpreted economic data for equity and fixed income portfolio managers. Also at Chancellor, Mr. Moeller worked as an equity analyst and was responsible for researching and rating companies in the economically sensitive automobile and housing industries for investment in Chancellor’s equity portfolio. Prior to joining Chancellor, Mr. Moeller was an Economist at Citibank from 1979 to 1984. He also analyzed pricing behavior in the metals industry for the Council on Wage and Price Stability in Washington, D.C. In 1999, Mr. Moeller received the award for most accurate forecast from the Forecasters' Club of New York. From 1990 to 1992 he was President of the New York Association for Business Economists. Mr. Moeller earned an M.B.A. in Finance from Fordham University, where he graduated in 1987. He holds a Bachelor of Arts in Economics from George Washington University.
More Economy in Brief


