 Global| Mar 22 2005
Federal Funds Rate Raised to 2.75%
by:Tom Moeller
|in:Economy in Brief
Summary
The Federal Open Market Committee raised the target rate for federal funds an expected 25 basis points to 2.75%. The discount rate also was raised 25 basis points to 3.75%. The decision to raise rates the seventh time since last June [...]
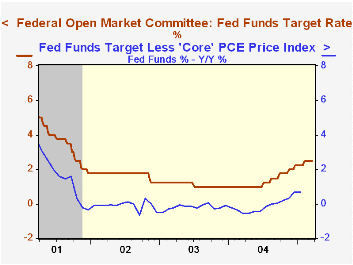
The Federal Open Market Committee raised the target rate for federal funds an expected 25 basis points to 2.75%. The discount rate also was raised 25 basis points to 3.75%.
The decision to raise rates the seventh time since last June was unanimous.
Today's press release from the Fed continued to contain a comment suggesting that rates could be raised again. "With underlying inflation expected to be contained, the Committee believes that policy accommodation can be removed at a pace that is likely to be measured."
With regard to prices the press release indicated "Though longer-term inflation expectations remain well contained, pressures on inflation have picked up in recent months and pricing power is more evident. The rise in energy prices, however, has not notably fed through to core consumer prices."
For the complete text of the Fed's latest press release please click here.
Paul Samuelson and Monetary Analysis from the Federal Reserve Bank of St. Louis can be found here.
PPI Rose A Moderate 0.4%, Core Pricing Calmerby Tom Moeller March 22, 2005
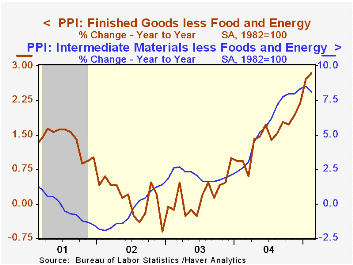
The Producer Price Index for finished goods rose 0.4% last month versus Consensus expectations for a 0.3% rise. The gain equaled the average of the prior twelve months. Excluding food & energy prices rose 0.1%, calmer than the 0.8% spike in January and equaled Consensus expectations.
The PPI for core finished consumer goods rose 0.2% (2.8% y/y) after the prior month's 0.9% jump. Prices for tobacco products again were strong and rose 0.5% (3.7% y/y) but consumer durable prices fell 0.5% (2.3% y/y) due to lower prices for passenger cars. Capital goods prices fell 0.2% (+2.8% y/y).
Finished energy prices rose 1.4% (11.9% y/y) due to higher gasoline prices (23.7% y/y) and higher fuel oil prices (46.0% y/y). Finished food prices jumped 0.8% (+4.9% y/y).
Intermediate goods prices nearly doubled the prior month's increase and rose 0.7%. Core intermediate prices again were firm and rose 0.5%, led higher by a 6.1% (10.8% y/y) increase in prices for softwood lumber.
Crude prices fell 1.6%, down for the third straight month as core crude prices dropped 3.0%. Prices for iron & steel scrap flopped 7.1% (-3.5% y/y). During the last thirty years "core" crude prices have been a fair indicator of industrial sector activity with a 48% correlation between the six month change in core crude prices and the change in factory sector industrial production.
| Producer Price Index | Feb | Jan | Y/Y | 2004 | 2003 | 2002 |
|---|---|---|---|---|---|---|
| Finished Goods | 0.4% | 0.3% | 4.7% | 3.6% | 3.2% | -1.3% |
| Core | 0.1% | 0.8% | 2.8% | 1.5% | 0.2% | 0.1% |
| Intermediate Goods | 0.7% | 0.4% | 8.4% | 6.6% | 4.6% | -1.5% |
| Core | 0.5% | 0.8% | 8.1% | 5.7% | 2.0% | -0.5% |
| Crude Goods | -1.6% | -2.0% | 8.1% | 17.6% | 25.1% | -10.6% |
| Core | -3.0% | -2.5% | 5.1% | 26.5% | 12.4% | 3.8% |
by Tom Moeller March 22, 2005
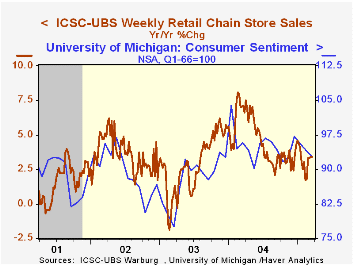
Chain store sales last week added 0.2% to the prior week's 0.6% advance according to the International Council of Shopping Centers (ICSC)-UBS survey.
Sales so far in March are 1.2% ahead of the February average which rose 1.0% from January.
During the last ten years there has been a 59% correlation between y/y change in chain store sales and the change in non-auto retail sales less gasoline, as published by the US Census Department.
The leading indicator of chain store sales from ICSC rose 0.3% in the latest week (0.2% y/y).
The ICSC-UBS retail chain-store sales index is constructed using the same-store sales (stores open for one year) reported by 78 stores of seven retailers: Dayton Hudson, Federated, Kmart, May, J.C. Penney, Sears and Wal-Mart.
| ICSC-UBS (SA, 1977=100) | 03/19/05 | 03/12/05 | Y/Y | 2004 | 2003 | 2002 |
|---|---|---|---|---|---|---|
| Total Weekly Chain Store Sales | 454.6 | 453.6 | 3.4% | 4.6% | 2.9% | 3.6% |
by Louise Curley March 22, 2005
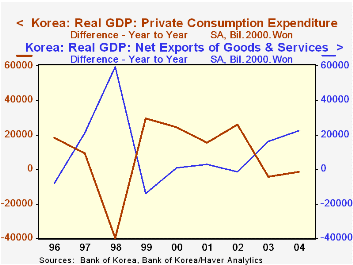
The Korean economy showed signs of continued improvement in the fourth quarter of last year as Real Gross Domestic Product (RGDP) rose 0.94% in the fourth quarter, compared with 0.81% in the third quarter. For the year 2004 as a whole, real GDP was up 4.66%, compared with 3.15% in the previous year.
Exports of goods and services in 2004 rose almost 20% in spite of a 15% appreciation of the won. Consumer expenditures remain subdued as consumers have been trying to restore their balance sheets after having gone on a buying spree during an earlier period of relaxed credit controls. At the end of last year, one in 13 persons was estimated to be three or more months behind on debt payments. The attached chart shows the divergent paths in the year to year increases in consumer spending and those in net exports.
Of the 30,768 billion 2000 won increase in RGDP between 2003 and 2004, 22,504 billion 2000 won, or 73% was accounted for by an increase in net exports. Consumption on the other hand, accounted for only 2.2% of the increase and while investment increased by 9,89l billion 2000 won, or 30.7%, more than half that, 18.1%, was due to inventory accumulation. Some of these figures may have been overstated as there was a statistical discrepancy in the total of -2,310.7 billion 2000 won, or -6.1%.
| Korea: Gross Domestic Product (Billions of 2000 Korean Won) |
2004 | 2003 | Difference | % of Dif |
|---|---|---|---|---|
| Gross domestic product | 693,420.0 | 662,654.9 | 30,769.1 | 100.0 |
| Final Consumption | 430,768.9 | 430,077.0 | 691.9 | 2.2 |
| Investment | 204,024.6 | 194,579 | 9,445.6 | 30.7 |
| Fixed | 202,927.5 | 199,048.0 | 3,879.5 | 12.6 |
| Inventories | 1097.1 | -4,469.0 | 5,566.1 | 18.1 |
| Net Exports | 58394.9 | 35,894.8 | 22,500.1 | 73.1 |
| Statistical discrepancy | 235.9 | 2,104.3 | -1,868.9 | -6.1 |
| Addendum: | % Chg | |||
| Exports | 359,995.2 | 300,824.5 | 59,170.7 | 19.7 |
| Imports | 301,600.3 | 264,929.7 | 36,670.6 | 13.8 |

Tom Moeller
AuthorMore in Author Profile »Prior to joining Haver Analytics in 2000, Mr. Moeller worked as the Economist at Chancellor Capital Management from 1985 to 1999. There, he developed comprehensive economic forecasts and interpreted economic data for equity and fixed income portfolio managers. Also at Chancellor, Mr. Moeller worked as an equity analyst and was responsible for researching and rating companies in the economically sensitive automobile and housing industries for investment in Chancellor’s equity portfolio. Prior to joining Chancellor, Mr. Moeller was an Economist at Citibank from 1979 to 1984. He also analyzed pricing behavior in the metals industry for the Council on Wage and Price Stability in Washington, D.C. In 1999, Mr. Moeller received the award for most accurate forecast from the Forecasters' Club of New York. From 1990 to 1992 he was President of the New York Association for Business Economists. Mr. Moeller earned an M.B.A. in Finance from Fordham University, where he graduated in 1987. He holds a Bachelor of Arts in Economics from George Washington University.
More Economy in Brief


