 Global| Dec 11 2007
Federal Funds Rate Lowered to 4.25%
by:Tom Moeller
|in:Economy in Brief
Summary
In a widely expected move, the target interest rate for Federal funds was lowered twenty five basis points to 4.25% at today's meeting of the Federal Open Market Committee. Voting against the decision was Eric S. Rosengren who [...]
In a widely expected move, the target interest rate for Federal funds was lowered twenty five basis points to 4.25% at today's meeting of the Federal Open Market Committee.
Voting against the decision was Eric S. Rosengren who preferred a 50 basis point cut.
The discount rate also was reduced twenty five basis points to 4.75%.
The Fed's rationale for today's move was that recent data indicated a slowing in the rate of expansion due to "intensification of the housing correction and some softening in business and consumer spending." Moreover, strains on financial markets were viewed to have increased.
Regarding price inflation, the FOMC judged "that some inflation risks remain, and it will continue to monitor inflation developments carefully."
For the complete text of the Fed's latest press release please follow this link.
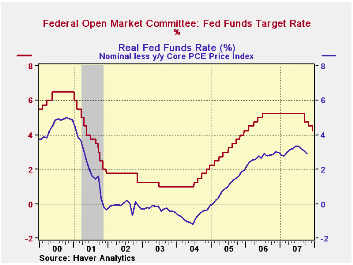
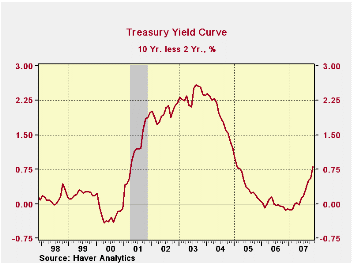
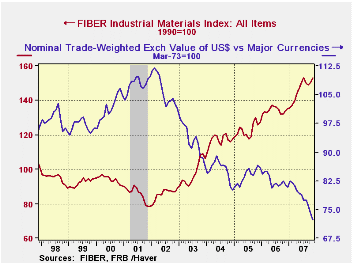
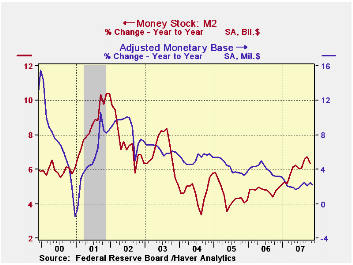
Other indicators of the current stance of U.S. monetary policy portray one of general ease. -- Easy - The yield curve already has steepened due to the decline in short term interest rates. This liquidity measure is not, however, near the most liquid of stances possible. -- Easy - The dollar's foreign exchange value is signaling an easy posture, down by roughly one-third since its 2002 high. -- Easy - Commodity prices are another signal of ease, nearly doubling since a 2002 low. -- Mixed - A mixed message is coming from the money supply measures. Growth in M2 has accelerated to a not too fast 6.3% rate of growth while growth in the monetary base has drifted lower to 2.2%. -- Tight - While down, the level of the "real" Fed funds rate still is high.
by Tom Moeller December 11, 2007
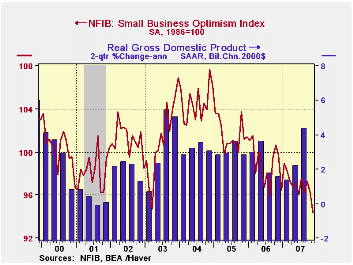
Small business optimism fell another 1.9% in November after the prior month's 1.1% drop according to the National Federation of Independent Business (NFIB). The decline was to the lowest level since September 1993.
During the last ten years there has been a 70% correlation between the level of the NFIB index and the two quarter change in real GDP.
The percentage of firms expecting higher real sales in six months fell to its lowest since 2003.
Respondents expecting the economy to improve fell to its lowest level in over a year.
The percentage of firms expecting to raise employment fell to
the lowest level this year. The percent with one or more job openings
now was at its lowest since 2003. During the last ten years there has
been a 72% correlation between the NFIB percentage and the y/y change
in nonfarm payrolls.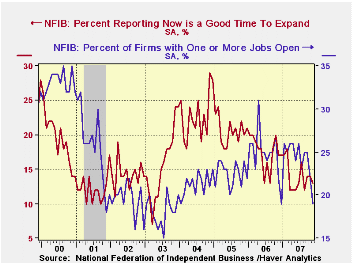
The percentage of firms indicating that credit was more difficult to get rose and reversed some of the decline during October.
The percent planning to raise capital expenditures remained near the lows of this cycle..The percentage of firms actually raising prices slipped m/m. During the last ten years there has been a 60% correlation between the change in the producer price index and the level of the NFIB price index. The percentage of firms planning to raise prices rose to its highest level this year.
About 24 million businesses exist in the United States. Small business creates 80% of all new jobs in America.
Availability of credit to small businesses is testimony given by Federal Reserve Board Governor Frederic S. Mishkin and it can be found here.
| Nat'l Federation of Independent Business | November | October | Y/Y | 2006 | 2005 | 2004 |
|---|---|---|---|---|---|---|
| Small Business Optimism Index (1986=100) | 94.4 | 96.2 | -5.3% | 98.9 | 101.6 | 104.6 |
by Louise Curley December 11, 2007
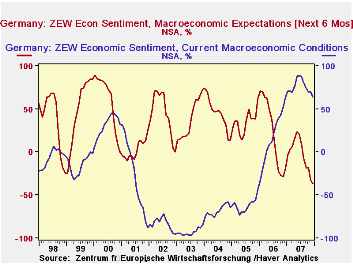
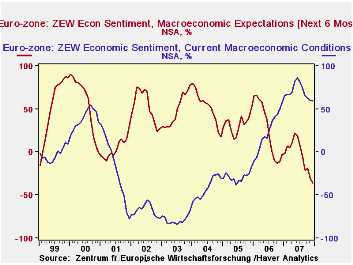
Institutional investors and analysts surveyed by ZEW the Center for European Economic Research at Manheim are becoming increasingly concerned about the economic outlook for the Euro Area and Germany, in particular. Among other concerns, the continued rise in the Euro and the widening repercussions of the problems in the U.S. sub prime mortgage market are taking their toll. The excess of pessimists over optimists regarding the outlook for the Euro Area increased to 35.7% in December from 30.0% in November. For Germany alone, the comparable figures were 37.2% and 32.5%.
The participants in the Survey are also becoming less confident about current conditions. The excess of optimists over pessimists regarding current conditions in the euro Area declined to 59.6% from 60.2% in November. The comparable figures for Germany were 63.5% and 70.0%. The first chart shows the balance of opinion on current conditions and expectations for the outlook for Germany and the second chart shows the comparable data for the Euro Area.
While confidence regarding current conditions is diminishing, it should be noted that in the historical context confidence both in Germany and the Euro Area as a whole remains at a high level, well above the period of low confidence in current conditions in the first half of this decade.
| ZEW INDICATORS (Percent Balance) | Dec 07 | Nov 07 | Dec 06 | M/M Chg | Y/Y Chg | 2006 | 2005 | 2004 |
|---|---|---|---|---|---|---|---|---|
| EUROSTAT | ||||||||
| Current Conditions | 59.6 | 60.2 | 56.8 | -0.6 | 2.8 | 70.0 | 23.8 | -28.7 |
| Expectations | -35.7 | -30.0 | -3.0 | -5.7 | -32.7 | -3.5 | 26.6 | 32.3 |
| GERMANY | ||||||||
| Current Conditions | 63.5 | 70.0 | 63.5 | -6.5 | 0.0 | 75.9 | 18.3 | -61.8 |
| Expectations | -37.2 | -32.5 | -19.0 | -4.7 | -18.2 | -3.0 | 22.3 | 34.8 |
by Tom Moeller December 11, 2007
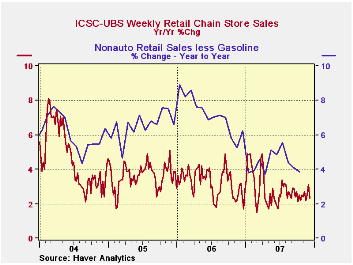
Chain store sales in December's first full week held the low level reached at the end of November. A 0.2% uptick was little recovery from the prior week's 2.0% w/w collapse according to the International Council of Shopping Centers (ICSC)-UBS.
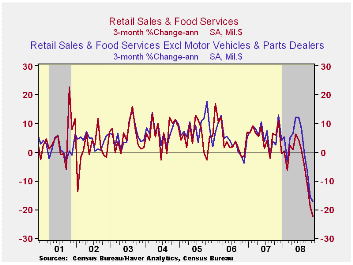
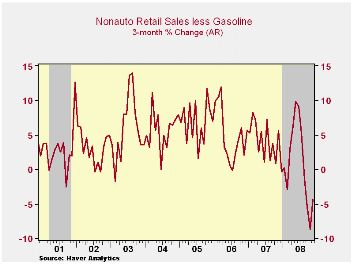
Sales began December 1.3% below the November average which fell 0.2% from the October average. During the last ten years there has been a 45% correlation between the y/y change in chain store sales and the change in nonauto retail sales less gasoline.The ICSC-UBS retail chain-store sales index is constructed using the same-store sales (stores open for one year) reported by 78 stores of seven retailers: Dayton Hudson, Federated, Kmart, May, J.C. Penney, Sears and Wal-Mart.
The leading indicator of chain store sales from ICSC-UBS rose 0.2% breaking a string of three consecutive weekly declines.
The Federal Reserve’s 2007 study of noncash payments is available here.
Housing, credit and consumer expenditure from the Federal Reserve Bank of Kansas City can be found here.
| ICSC-UBS (SA, 1977=100) | 12/08/07 | 11/31/07 | Y/Y | 2006 | 2005 | 2004 |
|---|---|---|---|---|---|---|
| Total Weekly Chain Store Sales | 469.3 | 468.5 | 2.3% | 3.3% | 3.6% | 4.7% |
by Robert Brusca December 11, 2007
Overall Japan orders are up sharply in October at 18.7% and
core orders are up a strong 12.7%. But over three months overall orders
are a strong +29.1% while core orders are off at a 14.5% pace. Over the
past 12 months core orders are up by just 3.6%. Since mid-2006 core
orders, those excluding large lumpy projects, are fluctuating around
zero. The foreign/domestic breakdown shows year/year orders strength is
coming from the foreign sector with growth in orders of 19.4% compared
to year/year domestic orders of just 6.6%.
| Japan Machinery Orders | ||||||
|---|---|---|---|---|---|---|
| m/m % | SAAR % | |||||
| SA | Oct-07 | Sep-07 | Aug-07 | 3-Mos | 6-Mos | 12-Mos |
| Total | 18.7% | -14.5% | 7.1% | 39.1% | 14.0% | 11.5% |
| Core Orders* | 12.7% | -7.6% | -7.7% | -14.5% | 13.9% | 3.6% |
| Total Orders | ||||||
| Foreign Demand | 16.0% | -7.8% | 23.0% | 199.4% | 35.6% | 19.4% |
| Domestic demand | 12.1% | -9.6% | -4.2% | -11.2% | 5.3% | 6.6% |
| * Excl ships and electric power | ||||||
by Robert Brusca December 11, 2007
Japan’s economy watchers index is very weak. The future index
is in the bottom 10 percent of its five year range. The current index
and the employment reading are in about the bottom 15th percentile of
their respective ranges. The Teikoku weighted indexes are weak in their
respective ranges for the entire spectrum of indexes but retailing and
wholesaling are on new five-year lows. MFG is in the bottom 10% of its
range. The Japanese readings are in accordance with the OECD LEI for
Japan from last week that showed conditions worsening sharply.
| Key Japanese Surveys | ||||||||
|---|---|---|---|---|---|---|---|---|
| Raw readings of each survey | Percent of 5Yr range* | |||||||
| Nov-07 | Oct-07 | Sep-07 | Aug-07 | Nov-07 | Oct-07 | Sep-07 | ||
| Diffusion | ||||||||
| Economy Watchers | 38.8 | 41.5 | 42.9 | 44.1 | 15.1% | 27.5% | 33.9% | |
| Employment | 41.9 | 43.8 | 48.8 | 48.3 | 14.7% | 21.5% | 39.4% | |
| Future | 38.8 | 43.1 | 46.0 | 46.5 | 10.6% | 32.2% | 46.7% | |
| NTC MFG | 50.8 | 49.5 | 49.8 | 49.6 | 30.2% | 15.5% | 18.7% | |
| Economy Trends (Teikoku'/50 neutral/weighted diffusion) | ||||||||
| MFG | 41.7 | 42.4 | 43.8 | 44.2 | 9.7% | 18.9% | 44.7% | |
| Retail | 34.4 | 37.2 | 37.7 | 38.3 | 0.0% | 17.1% | 22.5% | |
| Wholesale | 38.3 | 39.1 | 40.2 | 41.2 | 0.0% | 6.3% | 30.2% | |
| Services | 45.0 | 45.6 | 46.6 | 47.3 | 36.4% | 42.7% | 56.2% | |
| Construction | 32.6 | 34.7 | 36.8 | 36.3 | 22.8% | 43.8% | 68.9% | |
| 100 is high; Zero is low | ||||||||

Tom Moeller
AuthorMore in Author Profile »Prior to joining Haver Analytics in 2000, Mr. Moeller worked as the Economist at Chancellor Capital Management from 1985 to 1999. There, he developed comprehensive economic forecasts and interpreted economic data for equity and fixed income portfolio managers. Also at Chancellor, Mr. Moeller worked as an equity analyst and was responsible for researching and rating companies in the economically sensitive automobile and housing industries for investment in Chancellor’s equity portfolio. Prior to joining Chancellor, Mr. Moeller was an Economist at Citibank from 1979 to 1984. He also analyzed pricing behavior in the metals industry for the Council on Wage and Price Stability in Washington, D.C. In 1999, Mr. Moeller received the award for most accurate forecast from the Forecasters' Club of New York. From 1990 to 1992 he was President of the New York Association for Business Economists. Mr. Moeller earned an M.B.A. in Finance from Fordham University, where he graduated in 1987. He holds a Bachelor of Arts in Economics from George Washington University.
More Economy in Brief


