 Global| Aug 11 2005
European GDP Growth for Q2 Slows to 0.3% as Germany Stalls; Variations Wide in Seasonally Adjusted and Unadjusted [...]
Summary
European GDP slowed in Q2, according to the "Flash Estimate" published today by the EC Commission. Growth for the Euro-Zone 12 countries was 0.3%, off from 0.5% in Q1. GDP ran 1.2% ahead of a year ago. At the same time, the EU expects [...]
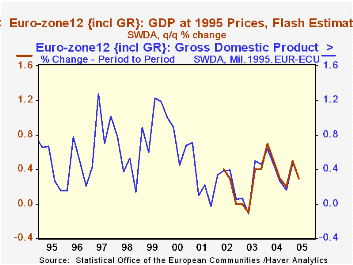
European GDP slowed in Q2, according to the "Flash Estimate" published today by the EC Commission. Growth for the Euro-Zone 12 countries was 0.3%, off from 0.5% in Q1. GDP ran 1.2% ahead of a year ago. At the same time, the EU expects Q3 and Q4 to improve, evidently due to the somewhat weaker euro; the "high" and "low" forecasts average to a 0.4% increase in Q3 and 0.6% in Q4.
The Q2 result is the net of widely varying outcomes among the countries reporting today. The German economy came to a dead stop, with zero change, although this followed a strong 0.8% gain in Q1. Growth over the last year has been 1.5%. Italy and the Netherlands, by contrast, saw Q2 rebounds after weak Q1 numbers. For Italy, this means that the year-on-year change is a mere 0.1%, but the Dutch economy has gained 1.3%. Spain maintained its Q1 pace of 0.9% in Q2 as well, with the year-on-year rate at 3.4%; it continues to sustain a growth trend well above other European economies.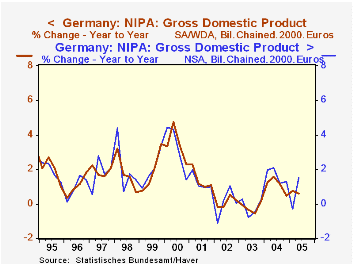
One technical note on the growth rates. In the table below, we show quarter-to-quarter changes based on seasonally adjusted data. But the year-on-year and annual figures come from not seasonally adjusted data. Seasonal adjustment is meant to smooth regular intra-year data movements. The year as a whole, however, should be unaffected by these shorter periodic changes, so the raw data is more appropriate for 12-month comparisons. Further, the calculations can produce different results as the seasonal forces might differ from year to year or the performance of components with varying weights might differ from year to year. A good example is Germany, where the second graph shows that year-on-year percent changes differ throughout, and in the table, the row showing annual growth calculated from seasonally adjusted figures is significantly different for Q2 over Q2 2004 and for 2004 as a whole. The Federal Statistics Office highlights the availability of two more trading days this year as a reason for the Q2 differential. Chain weighting and concurrent seasonal adjustment are two other factors that can increase the differences between the adjusted and unadjusted series in the most recent periods.
| Seasonally Adjusted Not Seasonally Adjusted | ||||||
|---|---|---|---|---|---|---|
| Q2 2005 | Q1 2005 | Year Ago | 2004 | 2003 | 2002 | |
| Euro-Zone 12 | 0.3 | 0.5 | 1.2 | 1.7 | 0.7 | 0.9 |
| Germany | 0.0 | 0.8 | 1.5 | 1.6 | -0.2 | 0.1 |
| Seasonally Adjusted Year | 0.6 | 1.1 | -0.2 | 0.1 | ||
| Italy | 0.7 | -0.5 | 0.1 | 1.0 | 0.4 | 0.4 |
| Spain | 0.9 | 0.9 | 3.4 | 3.1 | 2.9 | 2.7 |
| Netherlands | 1.2 | -0.8 | 1.3 | 1.7 | -0.1 | 0.1 |
Carol Stone, CBE
AuthorMore in Author Profile »Carol Stone, CBE came to Haver Analytics in 2003 following more than 35 years as a financial market economist at major Wall Street financial institutions, most especially Merrill Lynch and Nomura Securities. She had broad experience in analysis and forecasting of flow-of-funds accounts, the federal budget and Federal Reserve operations. At Nomura Securities, among other duties, she developed various indicator forecasting tools and edited a daily global publication produced in London and New York for readers in Tokyo. At Haver Analytics, Carol was a member of the Research Department, aiding database managers with research and documentation efforts, as well as posting commentary on select economic reports. In addition, she conducted Ways-of-the-World, a blog on economic issues for an Episcopal-Church-affiliated website, The Geranium Farm. During her career, Carol served as an officer of the Money Marketeers and the Downtown Economists Club. She had a PhD from NYU's Stern School of Business. She lived in Brooklyn, New York, and had a weekend home on Long Island.
More Economy in Brief


