 Global| Jan 17 2006
Empire State Index Slipped
by:Tom Moeller
|in:Economy in Brief
Summary
The January Empire State Index of General Business Conditions reversed all of the prior month's gain and fell 6.16 points to 20.12. Consensus expectations for the factory sector index had been for a lesser decline to 22. The figures [...]
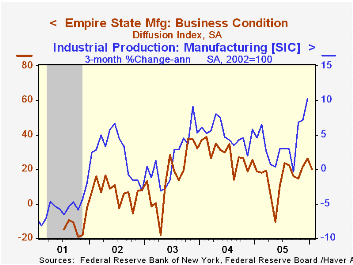
The January Empire State Index of General Business Conditions reversed all of the prior month's gain and fell 6.16 points to 20.12. Consensus expectations for the factory sector index had been for a lesser decline to 22. The figures reflect annual benchmark revision.
Since the series' inception in 2001 there has been a 76% correlation between the index level and the three month change in factory sector production.
Declines in inventories, delivery times and unfilled orders prompted the fall in the overall index. Otherwise, the component series increased. The shipments index rose to the highest level in over a year while the employment index reversed most of its December drop. The index of new orders was about unchanged and work hours rose to the highest level since October.
Pricing pressure remained about unchanged versus December and the levels remained down sharply from Fall peaks.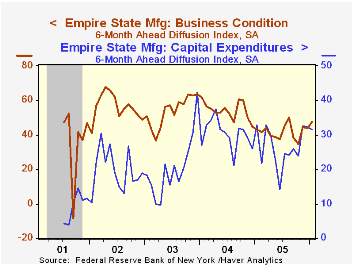
Like the Philadelphia Fed Index of General Business Conditions, the Empire State Business Conditions Index reflects answers to an independent survey question; it is not a weighted combination of the components.
The index of expectations for business conditions in six months improved 3.5 points to the highest level since August. Expectations for future capital spending slipped slightly as they did in December but remained at a relatively high level.
The Empire State Manufacturing Survey is a monthly survey of manufacturers in New York State conducted by the Federal Reserve Bank of New York. Participants from across the state in a variety of industries respond to a questionnaire and report the change in a variety of indicators from the previous month. Respondents also state the likely direction of these same indicators six months ahead. April 2002 is the first report, although survey data date back to July 2001.
For more on the Empire State Manufacturing Survey, including methodologies and the latest report, click here.
| Empire State Manufacturing Survey | Jan | Dec | Jan '05 | 2005 | 2004 | 2003 |
|---|---|---|---|---|---|---|
| General Business Conditions (diffusion index) | 20.12 | 26.28 | 19.02 | 15.56 | 28.79 | 15.98 |
by Tom Moeller January 17, 2006
Overall industrial output rose last month by 0.6% following an upwardly revised 0.8% increase during November. For the second month, the gain exceeded Consensus expectations which had been for a 0.5% rise. For all of 2005, output rose 3.1%. The gain was down from a 4.1% increase during 2004 but the two years together were the strongest in five years.
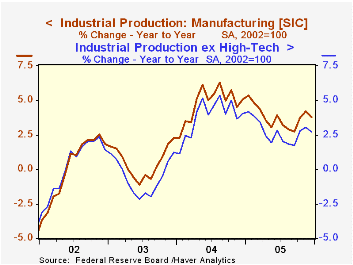
Factory sector production increased a scant 0.2% (4.1% y/y) following an upwardly revised 0.5% November increase. Again, the annual increase for all of 2005 in factory production of 3.8% was down versus a 5.0% increase during 2004.
Output of business equipment again was notably strong. A 2.7% (26.1% y/y) increase in high tech output was led by another 1.1% (11.7% y/y) increase in computer output, a 3.5% (30.8% y/y) spike in semiconductors and a 1.8% (25.2% y/y) surge in output of communications gear.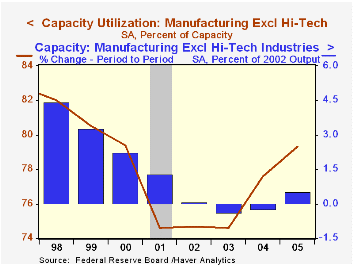
Excluding the high tech sector, factory output was unchanged (2.4% y/y) following an upwardly revised 0.3% November increase. For all 2005, output less the high tech sector rose 2.6% after a 3.8% rise during 2004.
Motor vehicle & parts output fell for the third straight month. The 2.8% (-2.4% y/y) decline slowed the annual increase in output to 2.8%, the worst for motor vehicles since 2002. Output of appliances, furniture & carpeting also fell for the third month but the 0.4% (+2.2% y/y) decline masked a 0.9% (-1.8% y/y) increase in furniture output.
Total capacity utilization rose to 80.7%, the highest level since late 2001. Capacity grew 1.6% y/y and for the year the 1.3% gain was the strongest since 2002. Factory sector utilization remained unchanged at 79.6% in December though the annual average during 2005 of 78.8% was the highest since 2000.
Excluding the high tech sector, the factory utilization rate slipped slightly in December to 80.1%. The annual average of 79.3% about matched the previous high during 2000. Capacity less the high tech sector grew a paltry 0.1% in December, about the monthly rate of the last year. While improved versus declines during 2003 & 2004, the 0.5% increase for all of last year compared unfavorably to a 4.5% increase during 1998.
| Production & Capacity | Dec | Nov | Y/Y | 2005 | 2004 | 2003 |
|---|---|---|---|---|---|---|
| Industrial Production | 0.6% | 0.8% | 2.9% | 3.1% | 4.1% | 0.6% |
| Consumer Goods | 0.2% | -0.7% | 1.3% | 2.0% | 2.1% | 1.0% |
| Business Equipment | 0.5% | 1.3% | 10.2% | 9.0% | 9.3% | 0.0% |
| Capacity Utilization | 80.7% | 80.3% | 79.7% (12/05) | 80.0% | 78.6% | 75.7% |

Tom Moeller
AuthorMore in Author Profile »Prior to joining Haver Analytics in 2000, Mr. Moeller worked as the Economist at Chancellor Capital Management from 1985 to 1999. There, he developed comprehensive economic forecasts and interpreted economic data for equity and fixed income portfolio managers. Also at Chancellor, Mr. Moeller worked as an equity analyst and was responsible for researching and rating companies in the economically sensitive automobile and housing industries for investment in Chancellor’s equity portfolio. Prior to joining Chancellor, Mr. Moeller was an Economist at Citibank from 1979 to 1984. He also analyzed pricing behavior in the metals industry for the Council on Wage and Price Stability in Washington, D.C. In 1999, Mr. Moeller received the award for most accurate forecast from the Forecasters' Club of New York. From 1990 to 1992 he was President of the New York Association for Business Economists. Mr. Moeller earned an M.B.A. in Finance from Fordham University, where he graduated in 1987. He holds a Bachelor of Arts in Economics from George Washington University.
More Economy in Brief


