 Global| Jan 16 2007
Empire State Index Dropped Sharply
by:Tom Moeller
|in:Economy in Brief
Summary
The January index of manufacturing activity in New York State softened considerably. The Index of General Business Conditions fell 13.06 points, the second down month, to 9.13. That was the lowest level since June 2003. Consensus [...]
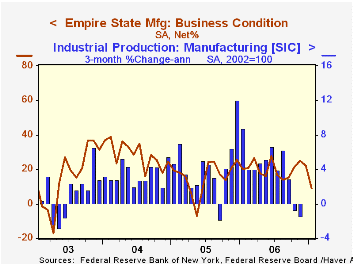
The January index of manufacturing activity in New York State softened considerably. The Index of General Business Conditions fell 13.06 points, the second down month, to 9.13. That was the lowest level since June 2003. Consensus expectations for the Empire State index had been for a more moderate decline to 19.5. The figures are reported by the Federal Reserve Bank of New York.
Since the series' inception in 2001 there has been a 75% correlation between the index level and the three month change in U.S. factory sector industrial production.
The indexes for new orders halved to 10.26, the lowest level since 2003, while the indexes for employment and shipments also fell considerably. The indexes for inventories and delivery times also fell sharply.
Like the Philadelphia Fed Index of General Business Conditions, the Empire State Business Conditions Index reflects answers to an independent survey question; it is not a weighted combination of the components.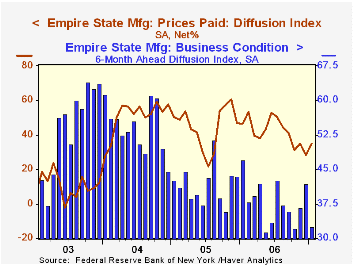
Pricing pressure improved moderately to the highest level since last September. The 7.02 rise in the prices paid index recovered all of the prior month's decline. Since 2001 there has been an 88% correlation between the index of prices paid and the three month change in the core intermediate materials PPI.
The Empire State index of expected business conditions in six months also fell sharply to the lowest level since last May. The index of expected new orders collapsed to the lowest since March 2006.
The Empire State Manufacturing Survey is a monthly survey of manufacturers in New York State conducted by the Federal Reserve Bank of New York. Participants from across the state in a variety of industries respond to a questionnaire and report the change in a variety of indicators from the previous month. Respondents also state the likely direction of these same indicators six months ahead. April 2002 is the first report, although survey data date back to July 2001.
For more on the Empire State Manufacturing Survey, including methodologies and the latest report, click here.
| Empire State Manufacturing Survey | January | December | Jan. '06 | 2006 | 2005 | 2004 |
|---|---|---|---|---|---|---|
| General Business Conditions (diffusion index) | 9.13 | 22.19 | 20.28 | 20.33 | 15.62 | 28.70 |
by Louise Curley January 16, 2007
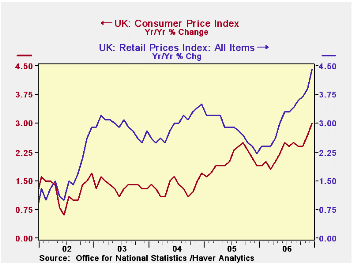
The UK inflation rate, based on the Harmonized Consumer Price Index (HCPI) rose to 3.0% in December from 2.7% in November. The rise was no surprise since the principal reason given for the Bank of England's increase in the base rate by 25 percentage points to 5.25% on January 11 was that the Bank had seen the December figure before its release to the public. The uncertainty since then lay in whether the December rise would be more than 1 percentage point above the inflation target of 2%. If that were the case, the Governor of the Bank of England would have had to write an open letter to the Chancellor of the Exchequer explaining why the inflation rate had risen by more than one percentage point above the 2% inflation target. Since the inflation rate was just short of the one percentage point, no letter will be required. Nevertheless, the increase in the inflation rate is a big one.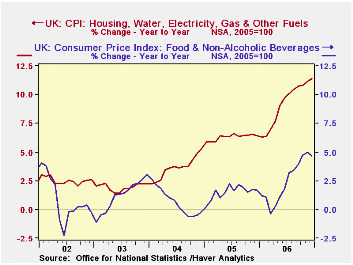
The HCPI was adopted on December 10, 2003 to insure comparability with other members of the European Union. In the UK it is known as the CPI. Prior to that time, the measure of inflation in the UK was based on the Retail Price Index (RPI) or the Retail Price Index excluding mortgage interest payments (RPIX). Inflation measures based on the CPI and on the RPI are shown in the first chart. Since the middle of 2002, inflation based on the RPI has been greater than that based on the CPI except for early 2005 when they were almost equal. The office of National Statistics publishes data explaining the difference between the CPI and the RPI. In December, of the -1.46 difference between the CPI and the PRI, -0.91 was due to the exclusion of mortgage interest payment and other housing components from the CPI, +.23 due to other differences of coverage, -0.56 due to differences in the formulas used to calculate the totals and -0.22 due to other differences including weights.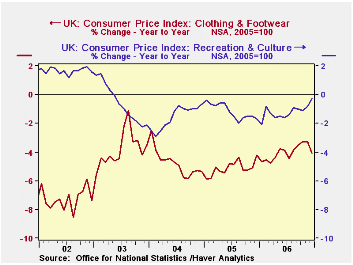
Among the factors contributing to the December rise in the CPI were the 11.38% increase in the prices of the Housing, Water, Electricity, Gas and Other Fuels component of the index and the 4.67% increase in the price of Food and Nonalcoholic Beverages component. The inflation in both of these rose sharply in the latter part of 2006, as can be seen in the second chart. Declines in the prices of Clothing and Footwear and Recreation and Culture components, shown in the third chart, helped to mitigate the overall rise in the index.
| INFLATION IN THE UNITED KINGDOM (%) | Dec 06 | Nov 06 | Oct 06 | Sep 06 | 2006 | 2005 | 2004 | 2003 |
|---|---|---|---|---|---|---|---|---|
| HCPI | 2.97 | 2.68 | 2.48 | 2.39 | 2.33 | 2.05 | 1.34 | 1.36 |
| RPI | 4.43 | 3.87 | 3.67 | 3.63 | 3.19 | 2.83 | 2.96 | 2.91 |
| RPIX | 3.79 | 3.43 | 3.17 | 3.17 | 2.93 | 2.27 | 2.21 | 2.81 |
| Housing, water, elec, gas, etc | 11.38 | 11.14 | 10.82 | 10.72 | 8.25 | 6.31 | 3.65 | 1.95 |
| Food, non alcoholic beverages | 4.67 | 5.00 | 4.72 | 3.81 | 2.50 | 1.51 | 0.66 | 1.18 |
| Recreation and Culture | -0.30 | -0.80 | -1.10 | -1.00 | -1.20 | -1.16 | -1.56 | -0.60 |
| Clothing and footwear | -4.10 | -3.28 | -3.30 | -3.50 | -4.04 | -2.0 | -4.76 | -3.82 |

Tom Moeller
AuthorMore in Author Profile »Prior to joining Haver Analytics in 2000, Mr. Moeller worked as the Economist at Chancellor Capital Management from 1985 to 1999. There, he developed comprehensive economic forecasts and interpreted economic data for equity and fixed income portfolio managers. Also at Chancellor, Mr. Moeller worked as an equity analyst and was responsible for researching and rating companies in the economically sensitive automobile and housing industries for investment in Chancellor’s equity portfolio. Prior to joining Chancellor, Mr. Moeller was an Economist at Citibank from 1979 to 1984. He also analyzed pricing behavior in the metals industry for the Council on Wage and Price Stability in Washington, D.C. In 1999, Mr. Moeller received the award for most accurate forecast from the Forecasters' Club of New York. From 1990 to 1992 he was President of the New York Association for Business Economists. Mr. Moeller earned an M.B.A. in Finance from Fordham University, where he graduated in 1987. He holds a Bachelor of Arts in Economics from George Washington University.
More Economy in Brief


