 Global| Jul 25 2002
Durable Goods Orders Plunge
by:Tom Moeller
|in:Economy in Brief
Summary
Durable goods orders collapsed unexpectedly last month. May figures were unrevised for the total. Orders for nondefense capital goods fell sharply due to broad based declines. May figures were revised lower due mostly to lowered [...]

Durable goods orders collapsed unexpectedly last month. May figures were unrevised for the total.
Orders for nondefense capital goods fell sharply due to broad based declines. May figures were revised lower due mostly to lowered figures for aircraft. Excluding aircraft, nondefense capital goods orders fell 5.2% following a 0.9% rise (revised up slightly) in May. Nondefense capital goods orders less aircraft were down 0.8% in June versus December.
Orders for computers and electronic products fell 3.9% (-2.6% YTD). Machinery orders fell 6.7% (-3.6% YTD). Orders for electrical equipment fell 0.7% (3.0% YTD).
Orders for defense goods rose 18.5% (1.6% YTD). Durable orders fell 4.8% (-0.8% YTD) excluding defense.
Durable shipments fell 1.4% (1.5% YTD) following a slight May decline.
Durable inventories fell 0.5% (-3.6% YTD), the seventeenth consecutive monthly decline.
| NAICS Classification | June | May | Y/Y | 2001 | 2000 | 1999 |
|---|---|---|---|---|---|---|
| Durable Goods Orders | -3.8% | 0.6% | -3.1% | -11.4% | 3.3% | 5.4% |
| Nondefense Capital Goods | -8.5% | 4.0% | -11.5% | -16.5% | 7.9% | 3.9% |
by Tom Moeller July 25, 2002
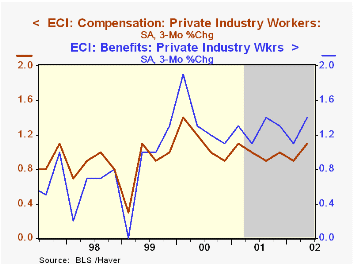
The employment cost index rose a much more than expected 1.1% last quarter due to a surge in benefit costs.
The gain in wages & salaries has risen since a low 0.7% 3Q01 and the gain in benefit costs rose to the top of the 1.1-1.4% range in place for some time.
Compensation gains in service industries halved a strong 1.2% gain in 1Q but gains in the goods producing sector accelerated.
| ECI- Private Industry Workers | 2Q'02 | 1Q'02 | Y/Y | 2001 | 2000 | 1999 |
|---|---|---|---|---|---|---|
| Compensation | 1.1% | 0.9% | 4.0% | 4.1% | 4.5% | 3.4% |
| Wages & Salaries | 1.0% | 0.9% | 3.6% | 3.7% | 3.9% | 3.5% |
| Benefit Costs | 1.4% | 1.1% | 5.1% | 5.0% | 5.7% | 3.4% |
by Tom Moeller July 25, 2002
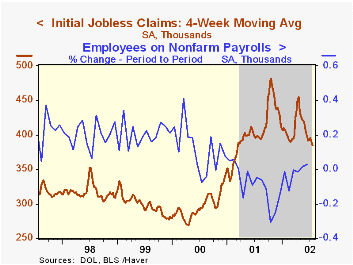
Initial claims for unemployment insurance fell more than expected in the latest week. The prior week's level was revised up slightly.
Continuing claims for unemployment insurance fell for the ninth week in ten. The prior week's level was revised down.
The four-week moving average of initial claims fell to 384,500, -3.6% y/y.
The insured rate of unemployment fell to 2.7%, the lowest level since February.
| Unemployment Insurance (000s) | 7/20/02 | 7/13/02 | Y/Y | 2001 | 2000 | 1999 |
|---|---|---|---|---|---|---|
| Initial Claims | 362.0 | 383.0 | -7.2% | 405.8 | 299.8 | 297.7 |
| Continuing Claims | -- | 3,518 | 16.6% | 3,021 | 2,114 | 2,186 |
by Tom Moeller July 25, 2002
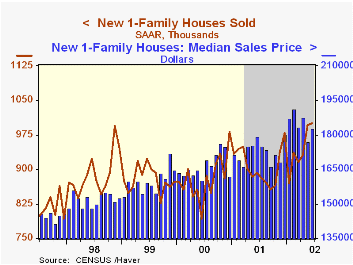
Sales of new single family homes rose more than expected last month. May sales were revised lower. The June sales rate was a record.
June sales of 985,000 were expected.
Sales were mixed across the country’s regions, with sales strongest in the West.
The median price of a new home rose 3.3% to $182,600 (1.8% y/y).
The new home sales data reflect current sales versus the existing home sales figure which reflect closings on past sales.
| Homes Sales (000s, AR) | June | May | Y/Y | 2001 | 2000 | 1999 |
|---|---|---|---|---|---|---|
| New Single-Family | 1,001 | 996 | 12.2% | 908 | 880 | 879 |
by Tom Moeller July 25, 2002
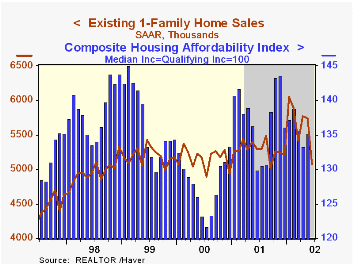
June sales of existing single family homes were much weaker than expected, falling 11.7% versus May that was little revised.
Home sales fell sharply in each of the country’s four regions.
The median price of an existing home rose 5.5% to $163,500 (7.4% y/y).
The figures reflect closings of past sales.
The average rate on a conventional 30-year mortgage fell to 6.65% last month versus 7.16% last June.
| Existing Home Sales (000, AR) | June | May | Y/Y | 2001 | 2000 | 1999 |
|---|---|---|---|---|---|---|
| Existing Single-Family | 5,070 | 5,740 | -4.3% | 5,291 | 5,159 | 5,193 |
by Tom Moeller July 25, 2002
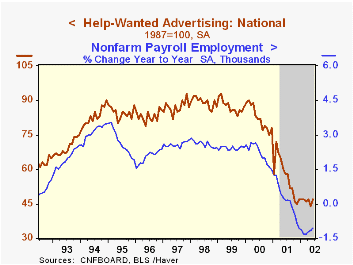
The Conference Board's National Index of Help-Wanted Advertising rose sharply in June following a May drop that was revised slightly deeper. The index has meandered sideways since December.
During the past ten years there has been a 91% correlation between the level of help-wanted advertising and the annual change in nonfarm payrolls.
Job opportunities improved across the nations' regions except the West South Central (Texas & Oklahoma).
The figures are seasonally adjusted.
| Conference Board | June '02 | May '02 | June '01 |
|---|---|---|---|
| National Help Wanted Index | 47 | 44 | 58 |

Tom Moeller
AuthorMore in Author Profile »Prior to joining Haver Analytics in 2000, Mr. Moeller worked as the Economist at Chancellor Capital Management from 1985 to 1999. There, he developed comprehensive economic forecasts and interpreted economic data for equity and fixed income portfolio managers. Also at Chancellor, Mr. Moeller worked as an equity analyst and was responsible for researching and rating companies in the economically sensitive automobile and housing industries for investment in Chancellor’s equity portfolio. Prior to joining Chancellor, Mr. Moeller was an Economist at Citibank from 1979 to 1984. He also analyzed pricing behavior in the metals industry for the Council on Wage and Price Stability in Washington, D.C. In 1999, Mr. Moeller received the award for most accurate forecast from the Forecasters' Club of New York. From 1990 to 1992 he was President of the New York Association for Business Economists. Mr. Moeller earned an M.B.A. in Finance from Fordham University, where he graduated in 1987. He holds a Bachelor of Arts in Economics from George Washington University.
More Economy in Brief


