 Global| Jan 19 2005
December CPI Fell. 2004 Average Raised by Less Goods Price Deflation
by:Tom Moeller
|in:Economy in Brief
Summary
Consumer Prices (CPI-U) declined 0.1% in December, the first decline since July. Consensus expectations had been for no change. During 2004 prices logged the largest increase in some time. December to December, the 3.4% gain was the [...]
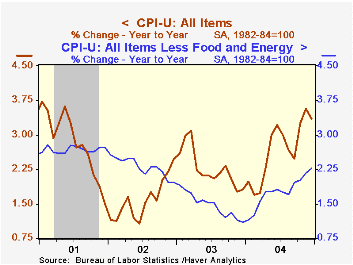
Consumer Prices (CPI-U) declined 0.1% in December, the first decline since July. Consensus expectations had been for no change. During 2004 prices logged the largest increase in some time. December to December, the 3.4% gain was the strongest since 2000 and the 2.7% rise for the whole year was the largest since 2001.
Prices less food & energy rose an expected 0.2% in December for the third consecutive month. Again, 2004 was the strongest year for "core" pricing in years; the 2.3% gain December to December the largest since 2001 and the 2.7% gain for the full year was the strongest since 1996. The firming was, however, not due to stronger price increases but to less deflation of goods prices.
"Core" commodities price inflation weakened in December as lower prices for furniture (-0.5% y/y), apparel (-0.4% y/y) and computers (-13.2% y/y) offset higher tobacco prices. The 0.9% full year decline in core goods prices was the third in a row but it was less of a fall than during the prior two years.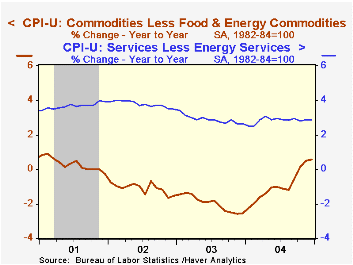
Services prices less energy also were tame last month, rising the same 0.2% as during the prior two. The full year increase of 2.8% was the weakest since 1999 as lower public transportation prices and lower communication prices offset faster gains in prices for shelter (2.7% y/y), medical care services (5.0% y/y) and tuition (7.1% y/y).
Lower energy prices pulled the CPI down last month, led lower by gasoline prices which fell 3.7% (+18.1% y/y) and lower fuel oil prices ((+15.5% y/y). Natural gas prices rose slightly (+3.8% y/y).
Food prices were unchanged in December but the full year gain of 3.5% was the strongest since 1990.
The chained CPI, which adjusts for shifts in the mix of consumer purchases, fell 0.4% in December. Similar to the PCE price deflator, core chain prices also fell last month and for the full year firmed moderately versus 2003.
| Consumer Price Index | Dec | Nov | Y/Y | 2004 | 2003 | 2002 |
|---|---|---|---|---|---|---|
| Total | -0.1% | 0.2% | 3.4% | 2.7% | 2.3% | 1.6% |
| Total less Food & Energy | 0.2% | 0.2% | 2.3% | 1.8% | 1.5% | 2.3% |
| Goods less Food & Energy | -0.1% | 0.1% | 0.6% | -0.9% | -2.0% | -1.1% |
| Services less Energy | 0.2% | 0.2% | 2.9% | 2.8% | 2.9% | 3.8% |
| Energy | -1.8% | 0.2% | 16.5% | 10.9% | 12.2% | -5.8% |
| Food | 0.0% | 0.2% | 2.7% | 3.5% | 2.1% | 1.8% |
| Chained CPI: Total (NSA) | -0.4% | 0.0% | 2.9% | 2.2% | 1.9% | 1.3% |
| Total less Food & Energy | -0.3% | 0.0% | 1.9% | 1.4% | 1.1% | 1.9% |
by Tom Moeller January 19, 2005
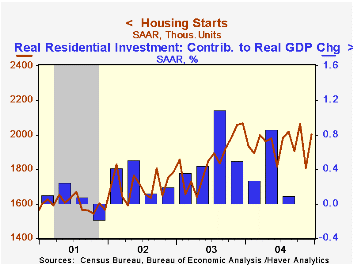
Housing starts rose 10.9% in December to 2.004M, were upwardly revised for November and beatConsensus expectations for 1.91M starts. Starts for all of last year of 1.948M were the most since 2.001M homes were started in 1978.
Higher single-family starts led the gain in December with a 13.1% m/m rise to 1.678M which more than reversed the sharp decline in November, capping off a record year. Single family starts of 1.601M in 2004 were a 6.4% improvement on the old record set the year prior.
Multi family starts also edged higher in December but just modestly. For the full year they ended slightly below the 2003 average.
Building permits slipped in December by 0.3% m/m to 2.021M after an upwardly revised gain in November.
| Housing Starts (000s, AR) | Dec | Nov | Y/Y | 2004 | 2003 | 2002 |
|---|---|---|---|---|---|---|
| Total | 2,004 | 1,807 | -3.0% | 1,948 | 1,853 | 1,7 10 |
| Single-family | 1,678 | 1,483 | 1.3% | 1,601 | 1,505 | 1,3 63 |
| Multi-family | 3 26 | 324 | -20.5% | 346 | 348 | 347 |
| Building Permits | 2,021 | 2,028 | 2.1% | 1,996 | 1,8 89 | 1,749 |
by Tom Moeller January 19, 2005
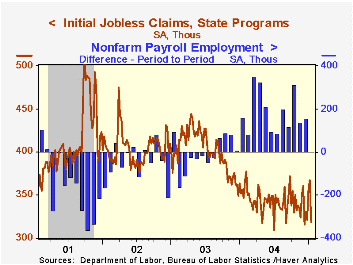
With a 48,000 w/w decline to 319,000 last week, initial claims for unemployment insurance reversed all of the gains during the prior two weeks and fell to the lowest level in a month. Consensus expectations had been for 345,000 claims.
The latest figure is for the survey period for January nonfarm payrolls and it was 12,000 (3.6%) below the December period.
The four week moving average of initial claims fell to 341,000 (-4.1% y/y).
During the last ten years there has been a (negative) 82% correlation between the level of initial claims and the y/y change in payroll employment.
Continuing claims for unemployment insurance rose 47,000 and reversed just some of the huge 209,000 drop the week prior.
The insured rate of unemployment was stable at 2.1%.
| Unemployment Insurance (000s) | 01/15/05 | 01/08/05 | Y/Y | 2004 | 2003 | 2002 |
|---|---|---|---|---|---|---|
| Initial Claims | 319 | 367 | -10.6% | 343 | 402 | 404 |
| Continuing Claims | -- | 2,694 | -15.4% | 2,926 | 3,531 | 3,570 |
by Tom Moeller January 19, 2005
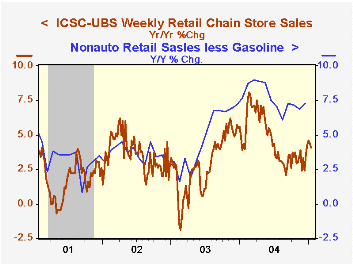
Chain store sales fell another 0.9% last week ion top of the 0.6% decline the week earlier, according to the International Council of Shopping Centers (ICSC)-UBS survey.
Despite the weekly declines, sales in January are 1.6% ahead of the December average.
During the last ten years there has been a 58% correlation between y/y change in chain store sales and the change in non-auto retail sales less gasoline, as published by the US Census Department.
The leading indicator of chain store sales from ICSC dropped for the third consecutive week (-1.4% y/y).
The ICSC-UBS retail chain-store sales index is constructed using the same-store sales (stores open for one year) reported by 78 stores of seven retailers: Dayton Hudson, Federated, Kmart, May, J.C. Penney, Sears and Wal-Mart.
| ICSC-UBS (SA, 1977=100) | 01/15/05 | 01/08/05 | Y/Y | 2004 | 2003 | 2002 |
|---|---|---|---|---|---|---|
| Total Weekly Chain Store Sales | 443.9 | 447.9 | 4.1% | 4.6% | 2.9% | 3.6% |
by Tom Moeller January 19, 2005
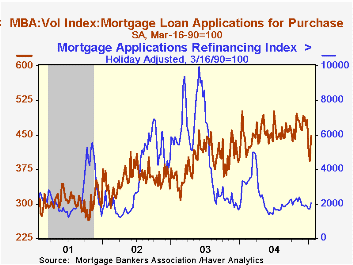
Mortgage applications rebounded 16.2% last week following three weeks of decline according to the Mortgage Bankers Association (MBA) Survey.
Refi's led the gain with a 19.1% rise and so far this year are 2.4% higher than in December.
Purchase applications also rose 14.0% w/w. Nevertheless, the level of purchase applications were 10.6% below the December average which fell 0.3% from November. During the last ten years there has been a 59% correlation between the y/y change in purchase applications and the change in new plus existing home sales.
The effective interest rate on a conventional 30-year mortgage slipped to 5.89% versus an average 6.05% during 2004 and 5.95% in December. The effective rate on a 15-year mortgage also fell to 5.44% last week.
The Mortgage Bankers Association surveys between 20 to 35 of the top lenders in the U.S. housing industry to derive its refinance, purchase and market indexes. The weekly survey accounts for more than 40% of all applications processed each week by mortgage lenders. Visit the Mortgage Bankers Association site here.
| MBA Mortgage Applications (3/16/90=100) | 01/14/05 | 01/07/05 | Y/Y | 2004 | 2003 | 2002 |
|---|---|---|---|---|---|---|
| Total Market Index | 682.9 | 587.8 | -25.5% | 735.1 | 1,067.9 | 799.7 |
| Purchase | 448.1 | 393.1 | -10.7% | 454.5 | 395.1 | 354.7 |
| Refinancing | 2,048.6 | 1,720.5 | -38.4% | 2,366.8 | 4,981.8 | 3,388.0 |

Tom Moeller
AuthorMore in Author Profile »Prior to joining Haver Analytics in 2000, Mr. Moeller worked as the Economist at Chancellor Capital Management from 1985 to 1999. There, he developed comprehensive economic forecasts and interpreted economic data for equity and fixed income portfolio managers. Also at Chancellor, Mr. Moeller worked as an equity analyst and was responsible for researching and rating companies in the economically sensitive automobile and housing industries for investment in Chancellor’s equity portfolio. Prior to joining Chancellor, Mr. Moeller was an Economist at Citibank from 1979 to 1984. He also analyzed pricing behavior in the metals industry for the Council on Wage and Price Stability in Washington, D.C. In 1999, Mr. Moeller received the award for most accurate forecast from the Forecasters' Club of New York. From 1990 to 1992 he was President of the New York Association for Business Economists. Mr. Moeller earned an M.B.A. in Finance from Fordham University, where he graduated in 1987. He holds a Bachelor of Arts in Economics from George Washington University.
More Economy in Brief


