 Global| Oct 16 2003
CPI Up Moderately
by:Tom Moeller
|in:Economy in Brief
Summary
The Consumer Price Index (CPI-U) rose 0.3% (2.3% y/y) in September. Consensus expectations were for a 0.2% gain. Less food & energy prices were tame, up 0.1% for the second month versus Consensus expectations for a 0.1% rise. The [...]
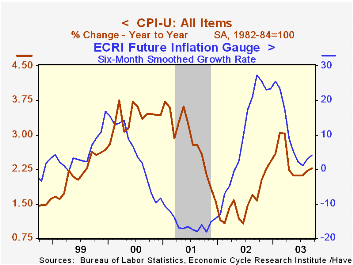
The Consumer Price Index (CPI-U) rose 0.3% (2.3% y/y) in September. Consensus expectations were for a 0.2% gain.
Less food & energy prices were tame, up 0.1% for the second month versus Consensus expectations for a 0.1% rise. The detail showed some incremental weakening in pricing power last month.
Tobacco prices fell 0.7% (-3.5% y/y). The CPI less food, energy & tobacco rose 0.1% (1.3% y/y).
Prices of core consumer goods fell 0.4%, the most for any month since May. This price measure has been deflating since early 2001 and is down 3.7% since the peak. Prices for new vehicles fell 0.4% (-1.6% y/y) and prices for household furnishings & operation also fell 0.4% (-2.3% y/y). Apparel prices rose 0.5% (-2.0%), all due to a rise in menswear prices.
Core services prices rose a modest 0.2% for the second month. Shelter prices ticked 0.1% (2.2% y/y) higher though medical care services prices rose 0.5% (4.4% y/y).Public transportation prices fell for the second month (2.2 y/y).Education & communication prices rose just 0.1% (1.3% y/y) following 0.5% jumps in August and July.
Energy prices surged another 3.0% on the strength of a 6.3% (21.0% y/y) rise in gasoline prices. All of that gain in gasoline prices has been given back with a 6.4% decline so far this month. Fuel oil prices fell 1.9% (+13.3% y/y). Piped gas & electricity prices ticked up 0.3% (9.5% y/y) following two months of decline.
The chained CPI which adjusts for shifts in consumer buying behavior rose 0.3% m/m for the second month. It is similar to the PCE price deflator. The core price measure rose 0.1%.
Analysis from the Federal Reserve Bank of San Francisco titled "Improving the Way We Measure Consumer Prices" can be found here.
| Consumer Price Index | Sept | Aug | Y/Y | 2002 | 2001 | 2000 |
|---|---|---|---|---|---|---|
| Total | 0.3% | 0.3% | 2.3% | 1.6% | 2.8% | 3.4% |
| Total less Food & Energy | 0.1% | 0.1% | 1.2% | 2.3% | 2.7% | 2.4% |
| Goods less Food & Energy | -0.4% | -0.1% | -2.4% | -1.1% | 0.3% | 0.5% |
| Services less Energy | 0.2% | 0.2% | 2.7% | 3.8% | 3.7% | 3.3% |
| Energy | 3.0% | 2.7% | 14.9% | -5.8% | 3.7% | 16.9% |
| Food & Beverages | 0.2% | 0.3% | 2.5% | 1.8% | 3.1% | 2.3% |
| Chained CPI: Total (NSA) | 0.3% | 0.3% | 1.8% | 1.3% | 2.3% | 2.0% |
| Total less Food & Energy | 0.1% | 0.0% | 0.7% | 1.8% | 2.0% | 1.4% |
by Tom Moeller October 16, 2003
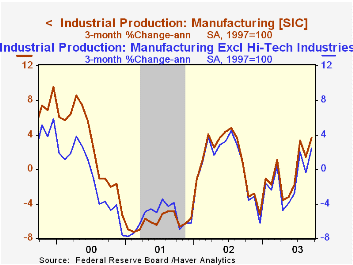
Industrial production rose 0.4% last month, as expected by the Consensus of economists. The previously reported 0.1% gain in August was revised to no change.
Output in the manufacturing sector surged 0.7% (-0.6% y/y), however the previously reported 0.2% decline in August was revised to -0.4%.
Output in selected high-technology industries surged another 1.4% (15.1% y/y). Output of computers and peripheral equipment jumped 2.0% (22.8% y/y) and output of semiconductors & related equipment surged 3.1% (24.5% y/y). Output of communications equipment fell 1.7% (-3.6% y/y).
Excluding high-tech, factory output jumped 0.7% (-1.6% y/y) on the strength of a 6.6% pop in output of motor vehicles & parts (5.0% y/y). Output of electrical equipment and appliances fell 0.5% (-2.8% Y/Y) and the previously reported 0.2% rise in August was revised to a 1.0% decline. Output of furniture fell 0.3% (-5.1% y/y) and output of non-durable goods ticked up 0.1% (-2.7% y/y).
Total capacity utilization rose slightly to 74.7% and capacity growth remained slow at 1.1% y/y.
| Production & Capacity | Sept | Aug | Y/Y | 2002 | 2001 | 2000 |
|---|---|---|---|---|---|---|
| Industrial Production | 0.4% | 0.0% | -0.5% | -0.8% | -3.5% | 4.7% |
| Capacity Utilization | 74.7% | 74.5% | 76.0%(9/02) | 75.6% | 77.3% | 82.7% |
by Tom Moeller October 16, 2003
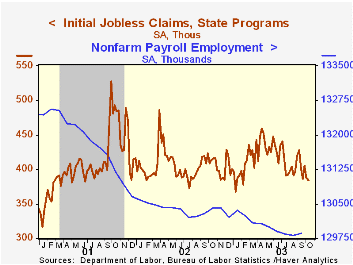
Initial claims for jobless insurance fell 4,000 to 384,000 last week. The prior week's decline was lessened slightly. Consensus expectations had been for claims of 385,000. Figures released next week will cover the October survey period for nonfarm payrolls.
The four-week moving average of initial claims fell to 390,750 (-5.4% y/y), the lowest level since early February.
Continuing claims for unemployment insurance rose 58,000 to 3,674,000 but the prior week's decline was deepened to 30,000.
The insured rate of unemployment held steady at 2.9%. The rate has averaged 2.9% since April.
| Unemployment Insurance (000s) | 10/11/03 | 10/04/03 | Y/Y | 2002 | 2001 | 2000 |
|---|---|---|---|---|---|---|
| Initial Claims | 384.0 | 388.0 | -7.0% | 404.3 | 406.0 | 299.7 |
| Continuing Claims | -- | 3,674 | 0.0% | 3,575 | 3,022 | 2,114 |
by Tom Moeller October 16, 2003
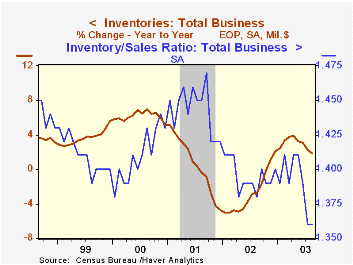
Total business inventories fell quite a bit more than expected (-0.4%) in August due to a huge decline in motor vehicles. Consensus expectations were for a 0.1% drop.
Retail inventories plummeted 0.8% as inventories of motor vehicles and parts dropped 2.0% (11.2% y/y). That was achieved by a 1.9% cut in vehicle output as reported by the Federal Reserve.
Non-auto inventories fell 0.1%, led lower by a 0.8% (1.3% y/y) decline in inventories at general merchandise stores. Inventories of furniture (5.4% y/y) and building materials (7.8% y/y) continued strong.
Overall business sales fell 0.2% m/m (3.4% y/y) due to a 1.8% decline (+1.6% y/y) in factory shipments.
The inventory-to-sales ratio was stable at the record low level of 1.36.
| Business Inventories | Aug | July | Y/Y | 2002 | 2001 | 2000 |
|---|---|---|---|---|---|---|
| Total | -0.4% | -0.2% | 1.9% | 2.1% | -4.7% | 5.1% |
| Retail | -0.8% | -0.1% | 5.3% | 7.6% | -2.9% | 6.0% |
| Retail excl. Autos | -0.1% | 0.2% | 2.5% | 2.5% | -1.2% | 3.7% |
| Wholesale | -0.2% | 0.0% | 0.7% | 0.4% | -4.9% | 6.1% |
| Manufacturing | -0.2% | -0.4% | -0.7% | -1.8% | -6.1% | 3.8% |
by Tom Moeller October 16, 2003
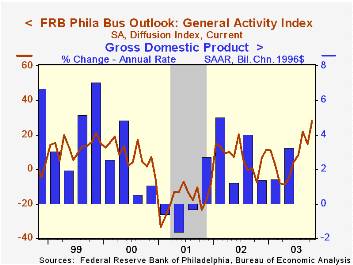
The Philadelphia Fed’s index of general business conditions rose strongly in October to 28.0 versus 14.6 in September. Consensus expectations were for a reading of 16.0.
During the last twenty years there has been a 65% correlation between the level of the Philadelphia Fed Business Conditions Index and quarterly growth in real GDP. The correlation with quarterly growth in factory sector industrial production has been 77%.
The business conditions index was at its highest level since July 1996, the improvement directionally consistent with yesterday's Empire State Manufacturing Survey.
Amongst the sub indexes, new orders jumped nearly 10 points m/m to its highest since 1996. Shipments (28.8) also leaped higher and the employment index (5.5) rose to its highest in over three years.
The business conditions index reflects a separate survey question, not the sub indexes.
A separate survey of expected business conditions in six months backpedaled to 55.5, reversing the improvement in 3Q.
The prices paid index was about stable at 22.3.
The Philadelphia Fed index is based on a survey of 250 regional manufacturing firms, but these firms sell nationally and internationally.
The latest Business Outlook survey from the Philadelphia Federal Reserve Bank can be found here .
| Philadelphia Fed Business Outlook | Oct | Sept | Oct '02 | 2002 | 2001 | 2000 |
|---|---|---|---|---|---|---|
| General Activity Index | 28.0 | 14.6 | -7.5 | 7.7 | -17.2 | 8.3 |
| Prices Paid Index | 22.3 | 22.5 | 18.6 | 12.2 | -0.9 | 27.2 |

Tom Moeller
AuthorMore in Author Profile »Prior to joining Haver Analytics in 2000, Mr. Moeller worked as the Economist at Chancellor Capital Management from 1985 to 1999. There, he developed comprehensive economic forecasts and interpreted economic data for equity and fixed income portfolio managers. Also at Chancellor, Mr. Moeller worked as an equity analyst and was responsible for researching and rating companies in the economically sensitive automobile and housing industries for investment in Chancellor’s equity portfolio. Prior to joining Chancellor, Mr. Moeller was an Economist at Citibank from 1979 to 1984. He also analyzed pricing behavior in the metals industry for the Council on Wage and Price Stability in Washington, D.C. In 1999, Mr. Moeller received the award for most accurate forecast from the Forecasters' Club of New York. From 1990 to 1992 he was President of the New York Association for Business Economists. Mr. Moeller earned an M.B.A. in Finance from Fordham University, where he graduated in 1987. He holds a Bachelor of Arts in Economics from George Washington University.
More Economy in Brief


