 Global| Apr 16 2003
CPI Up, Core Inflation Stable
by:Tom Moeller
|in:Economy in Brief
Summary
The Consumer Price Index (CPI-U) rose slightly less than Consensus expectations for a 0.4% rise. The 0.3% increase again was boosted by higher energy prices. The CPI less food and energy was unchanged for the first month since [...]
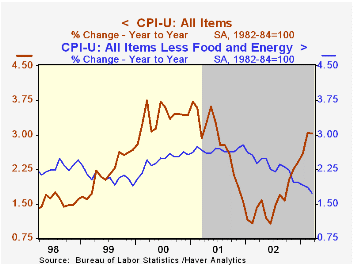
The Consumer Price Index (CPI-U) rose slightly less than Consensus expectations for a 0.4% rise. The 0.3% increase again was boosted by higher energy prices.
The CPI less food and energy was unchanged for the first month since February 1999. The 1.3% (AR) gain in core prices during 1Q 2003 was the lowest since 3Q 1965.
Core services prices did not rise (with rounding) for the first time since December 1982 and rose just 2.6% (AR) last quarter. Shelter prices fell slightly (2.5% y/y) following an unchanged reading in February. Medical care services prices rose just 0.1% (4.7% y/y).Education and communication prices also fell slightly (2.6% y/y). Public transportation prices rose slightly (-0.9% y/y) but were down 1.0% for the quarter .
Apparel prices continued a decline begun in 1998, down in March by 0.4%(-3.5% y/y). New and used vehicle prices managed a 0.3% gain (-1.6% y/y). Prices for household furnishings and operation fell 0.5% (-1.2% y/y) and reversed all of the slight gains in the prior two months. Medical care commodities rose 0.4% (2.9% y/y).
Energy prices were strong again last month. Through March energy prices rose 15.3% versus yearend led by a 21.9% gain in gasoline prices, but so far in April gasoline prices are down 4.7% versus March. Fuel oil prices rose 9.0% (49.8% y/y). Piped gas & electricity prices jumped 5.0% (9.8% y/y).
The chained CPI which adjusts for shifts in consumer buying behavior rose 0.6%. It is similar to the PCE price deflator. The core price measure rose 0.3%. These gains are the same as the not seasonally adjusted gains in the CPI-U.
Research from the Federal Reserve Bank of St. Louis titled Symmetric Inflation Risk can be found here.
| Consumer Price Index | Mar | Feb | Y/Y | 2002 | 2001 | 2000 |
|---|---|---|---|---|---|---|
| Total | 0.3% | 0.6% | 3.0% | 1.6% | 2.8% | 3.4% |
| Total less Food & Energy | 0.0% | 0.1% | 1.7% | 2.3% | 2.7% | 2.4% |
| Goods less Food & Energy | -0.1% | -0.1% | -1.4% | -1.1% | 0.3% | 0.5% |
| Services less Energy | 0.0% | 0.1% | 3.0% | 3.8% | 3.7% | 3.3% |
| Energy | 4.6% | 5.9% | 23.0% | -5.8% | 3.7% | 16.9% |
| Food & Beverages | 0.2% | 0.7% | 1.4% | 1.8% | 3.1% | 2.3% |
| Chained CPI: Total (NSA) | 0.6% | 0.8% | 2.9% | 1.2% | 2.1% | 2.0% |
| Total less Food & Energy | 0.3% | 0.3% | 1.4% | 1.7% | 1.9% | 1.4% |
by Tom Moeller April 16, 2003
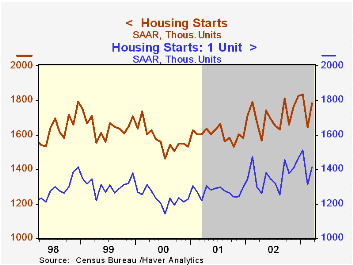
Housing starts recovered slightly more than expected last month. Total starts rose 8.3% to 1.78 mil. from an upwardly revised February level. Consensus expectations had been for starts to rise to 1.70 mil. units.
Single family starts rose 7.7% m/m from a weather-depressed February (revised up), but for the quarter were down slightly versus 4Q02.
Multi-family starts rose a sharp 10.6% following a moderate February gain. The 7.0% gain multi-family starts last quarter followed a 23.4% decline in 4Q02.
Building permits fell 7.0% last month and the decline left permits 10.7% below the peak of last December. Single family permits fell a more moderate 1.0% and are down 7.4% from the December peak.
| Housing Starts (000s, AR) | Mar | Feb | Y/Y | 2002 | 2001 | 2000 |
|---|---|---|---|---|---|---|
| Total | 1,780 | 1,644 | 6.3% | 1,709 | 1,603 | 1,573 |
| Single Family | 1,414 | 1,313 | 8.9% | 1,364 | 1,273 | 1,232 |
| Multi Family | 366 | 331 | -2.9% | 346 | 330 | 341 |
| Building Permits | 1,685 | 1,811 | 3.4% | 1,717 | 1,639 | 1,598 |
by Tom Moeller April 16, 2003

The National Association of Home Builders Housing Market Index remained depressed in April following sharp declines in the prior three months. Unchanged from March, the index of home builders' sentiment remained at its lowest since November of 2001.
The index of current market conditions fell slightly to the lowest level since November 2001. The index which measures expected sales in six months rose and mostly recovered the sharp drop in March.
Traffic of prospective buyers remained very depressed at the lowest level since November 2001.
The NAHB index is a diffusion index based on a survey of builders. Readings above 50 signal that more builders view conditions as good than poor.
For a description of the housing market index from the National Association of Home Builders, visit the NAHB website.
| Nat'l Association of Home Builders | April | Mar | Y/Y | 2002 | 2001 | 2000 |
|---|---|---|---|---|---|---|
| Composite Housing Market Index | 52 | 52 | 61 | 61 | 56 | 62 |
by Tom Moeller April 16, 2003
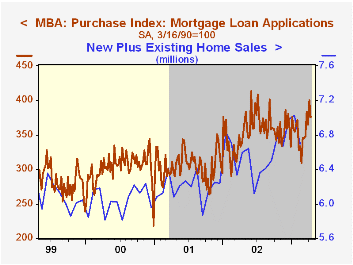
The index of mortgage applications compiled by the Mortgage Bankers Association dropped 8.9% last week. It was the fourth consecutive weekly decline during which applications have fallen by almost one third.
Last week's decline again was led by a sharp decline in applications to refinance. Off 10.0% last week, refis are down 40.9% during the last four weeks.
Mortgage applications for home purchase fell 6.2% last week (11.5% y/y) and reversed much of the prior week's surge. During the last five years there has been a 63% correlation between the y/y change in purchase applications and the change in new plus existing home sales.
The average size of a mortgage loan application fell slightly to $178,600 (-2.2% y/y). The average size of an application for home purchase rose to $191,700 (+4.8% y/y).
Interest rates on a conventional 30-Year mortgage fell last week. The contract rate fell to 5.70% versus 5.80% the prior week and the effective rate (incl. points) fell to 5.99%. The effective rate on a 15-year mortgage fell to 5.40%.
Visit the Mortgage Bankers Association site at http://www.mbaa.org.
| MBA Mortgage Applications (3/16/90=100) | 4/11/03 | 4/04/03 | 2002 | 2001 | 2000 |
|---|---|---|---|---|---|
| Total Market Index | 1,134.6 | 1,246.1 | 799.7 | 625.6 | 322.7 |
| Purchase | 376.1 | 400.8 | 354.7 | 304.9 | 302.7 |
| Refinancing | 5,546.7 | 6,162.8 | 3,388.0 | 2,491.0 | 438.8 |

Tom Moeller
AuthorMore in Author Profile »Prior to joining Haver Analytics in 2000, Mr. Moeller worked as the Economist at Chancellor Capital Management from 1985 to 1999. There, he developed comprehensive economic forecasts and interpreted economic data for equity and fixed income portfolio managers. Also at Chancellor, Mr. Moeller worked as an equity analyst and was responsible for researching and rating companies in the economically sensitive automobile and housing industries for investment in Chancellor’s equity portfolio. Prior to joining Chancellor, Mr. Moeller was an Economist at Citibank from 1979 to 1984. He also analyzed pricing behavior in the metals industry for the Council on Wage and Price Stability in Washington, D.C. In 1999, Mr. Moeller received the award for most accurate forecast from the Forecasters' Club of New York. From 1990 to 1992 he was President of the New York Association for Business Economists. Mr. Moeller earned an M.B.A. in Finance from Fordham University, where he graduated in 1987. He holds a Bachelor of Arts in Economics from George Washington University.


