 Global| Apr 19 2006
CPI Up An Expected 0.4% During March
by:Tom Moeller
|in:Economy in Brief
Summary
During March, the consumer price index (CPI-U) rose 0.4% following a 0.1% February up tick and matched Consensus expectations. The 0.3% rise in prices less food & energy, however, was slightly firmer than expected. Prices for core [...]
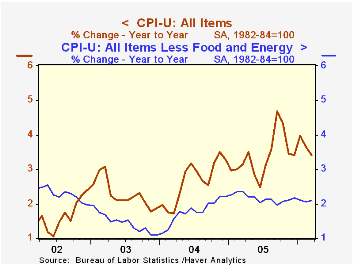
During March, the consumer price index (CPI-U) rose 0.4% following a 0.1% February up tick and matched Consensus expectations. The 0.3% rise in prices less food & energy, however, was slightly firmer than expected.
Prices for core goods rose 0.3% (0.2% y/y) after a 0.1% February decline. Apparel prices reversed all of the prior month's drop with a 1.0% (-1.2% y/y) increase and household furnishings & operation prices ticked up 0.1% (0.5% y/y) after no change during February. Medical care commodity prices rose 0.4% (4.1% y/y) while tobacco prices rose a strong 0.6% (4.5% y/y). New & used motor vehicle prices fell 0.1% (+0.4% y/y).
Another 0.3% increase in core services prices reflected a second 0.4% (2.6% y/y) increase in shelter prices. Medical care services prices increased 0.4% (4.1% y/y) while school tuition & fees posted a firm 0.5% (6.1% y/y) gain. Public transportation prices fell by 0.3% (+5.9% y/y), the third decline in the last four months.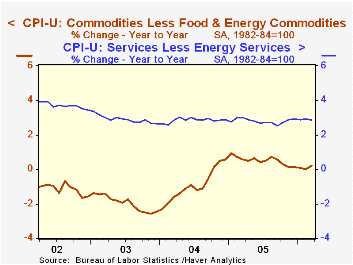
Energy prices during March reversed all of the prior month's decline with a 1.3% jump led by a 3.6% (17.0% y/y) spurt in gasoline prices, which have moved 10.7% higher so far during April. Natural gas & electricity prices fell 1.1% (+17.8% y/y) for the third decline in the last four months and fuel oil prices ticked up 0.4% (17.9% y/y).
Food prices inched up another 0.1%, the gain held back by a 1.7% (+6.4% y/y) decline in fruits & vegetables prices. Meat, fish & poultry prices reversed all of the prior month's decline with a 0.3% (0.9% y/y) rise.
The chained CPI, which adjusts for shifts in the mix of consumer purchases, jumped 0.5% and less food & energy prices rose a stronger 0.6%.
Minutes to the latest FOMC meeting can be found here.
The Interaction of Labor Markets and Inflation: Micro Evidence from the International Wage Flexibility Project from the Federal Reserve Bank of San Francesco is available here.
| Consumer Price Index | Mar | Feb | Y/Y | 2005 | 2004 | 2003 |
|---|---|---|---|---|---|---|
| Total | 0.4% | 0.1% | 3.4% | 3.4% | 2.7% | 2.3% |
| Total less Food & Energy | 0.3% | 0.1% | 2.1% | 2.2% | 1.8% | 1.5% |
| Goods less Food & Energy | 0.3% | -0.1% | 0.2% | 0.5% | -0.9% | -2.0% |
| Services less Energy | 0.3% | 0.3% | 2.8% | 2.8% | 2.8% | 2.9% |
| Energy | 1.3% | -1.2% | 17.3% | 16.9% | 10.8% | 12.2% |
| Food | 0.1% | 0.1% | 2.6% | 2.4% | 3.4% | 2.1% |
| Chained CPI: Total (NSA) | 0.5% | 0.3% | 3.0% | 2.9% | 2.5% | 2.0% |
| Total less Food & Energy | 0.6% | 0.4% | 2.0% | 1.9% | 1.7% | 1.1% |

Tom Moeller
AuthorMore in Author Profile »Prior to joining Haver Analytics in 2000, Mr. Moeller worked as the Economist at Chancellor Capital Management from 1985 to 1999. There, he developed comprehensive economic forecasts and interpreted economic data for equity and fixed income portfolio managers. Also at Chancellor, Mr. Moeller worked as an equity analyst and was responsible for researching and rating companies in the economically sensitive automobile and housing industries for investment in Chancellor’s equity portfolio. Prior to joining Chancellor, Mr. Moeller was an Economist at Citibank from 1979 to 1984. He also analyzed pricing behavior in the metals industry for the Council on Wage and Price Stability in Washington, D.C. In 1999, Mr. Moeller received the award for most accurate forecast from the Forecasters' Club of New York. From 1990 to 1992 he was President of the New York Association for Business Economists. Mr. Moeller earned an M.B.A. in Finance from Fordham University, where he graduated in 1987. He holds a Bachelor of Arts in Economics from George Washington University.


