 Global| Oct 15 2009
CPI Total & Core IncreaseJust Modestly Despite Economic Improvement
by:Tom Moeller
|in:Economy in Brief
Summary
Despite recent moderate economic improvement, pricing pressure remained very much under control last month as indicated by weak gains in consumer prices. Perhaps the economy's improvement owes much to that weakened pricing power. [...]
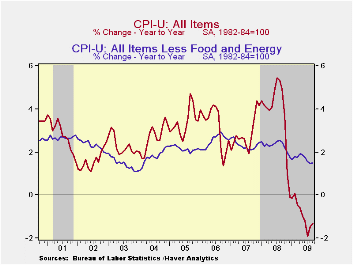
Despite recent moderate economic improvement, pricing pressure remained very much under control last month as indicated by weak gains in consumer prices. Perhaps the economy's improvement owes much to that weakened pricing power. Nevertheless, the overall September CPI matched Consensus expectations and rose 0.2%, half the unrevised August increase. Helped by lower energy prices, the index versus last year declined 1.3% which was near the record for a twelve-month period. Stripping out food & energy prices, the monthly gain of 0.2% was just slightly more than expectations but the y/y increase of 1.5% was the weakest since early-2004.
Earlier strength in energy prices took a breather last month
and rose 0.6% after a 4.6% August increase. Nevertheless, energy prices
during the last three months have risen at a strong 21.1% annual rate.
Gasoline prices rose just 0.1% (-29.7% y/y) after a 9.1% jump during
August. Fuel oil prices were a bit stronger ahead of the winter heating
season. They rose 1.1% (-32.2% y/y) after a 3.9% August gain. Finally,
prices for natural gas & electricity rose just 0.1% (-8.3% y/y)
after no change during the prior month.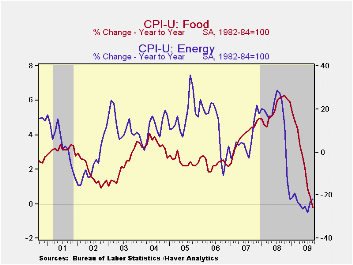
Food & beverage prices also were weak last month and ticked 0.1% lower, reversing a similar August uptick. That left prices roughly unchanged versus September '08. It was the lowest nine-month change since 1967 and down from the peak 6.1% rate of increase last fall. Recent weakness has been led by lower dairy prices (-9.5% y/y) and lower fruit & vegetable (-6.5% y/y) prices. Prices for meats, poultry, fish & eggs also fell by 3.9% y/y while cereals & bakery product prices ticked up just 0.1%.
Gains in the CPI less food & energy also remained moderate. However, the 0.2% September increase was slightly firmer than expected. In addition, price gains accelerated to a 2.0% annual rate since December of last year. That's only slightly below the 2.3% rates of increase during the last two years.
The acceleration in core price inflation this year owes to core
goods prices. Their 0.3% increase last month lifted the
annualized rate so far in 2009 to 2.9% from no change during the prior
two years. Higher tobacco prices account for much of that acceleration
as they have risen at a 38.9% rate since December. However, there has
been modest firming of prices elsewhere. Prices for new & used
motor vehicles have firmed this year despite an aggressive marketing
campaign. They rose 0.5% last month and at a 3.3% rate since December.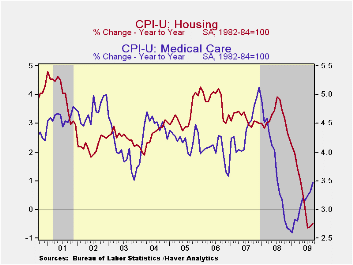 That compares with price deflation during the last two years. Apparel
prices ticked up 0.1% last month and are up at a 3.1% rate this year.
That follows price declines which extend back to 1994. Continuing weak
were prices for household furnishings & operation. They slipped
last month for the fifth month in the last six and are down at a 0.5%
rate so far this year.
That compares with price deflation during the last two years. Apparel
prices ticked up 0.1% last month and are up at a 3.1% rate this year.
That follows price declines which extend back to 1994. Continuing weak
were prices for household furnishings & operation. They slipped
last month for the fifth month in the last six and are down at a 0.5%
rate so far this year.
The U.S. recession continued to sap the strength from core
services prices. They ticked up just 0.1% last month and have
risen at just a 1.6% annual rate so far this year; half that in 2008
and nearly the weakest since 1983. Weakness in the housing market
accounts for much of that moderation. Last month, shelter prices
slipped and they've risen at a just a 0.6% annual rate so far in 2009.
Owners equivalent rent of primary residences, a measure not equivalent
to other house price measures, slipped during September and have risen
at a 1.2% rate so far this year versus a 2.5% 2008 increase. Elsewhere,
public transportation prices posted their third consecutive month of
strength and rose 2.1%.Also firming last month were medical care
services prices with a 0.4% increase and a 3.6% YTD gain. In addition,
education costs have been firm and they're up at a 5.0% annual rate
this year.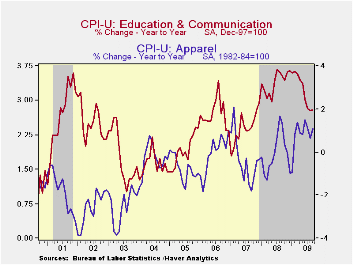
The chained CPI, which adjusts for shifts in consumption patterns, rose 0.1% during September while year-to-year prices fell 1.4%. Conversely, chained prices less food and energy firmed last month by 0.2%, the first material gain in five months and the YTD increase rose to 2.2%.
The consumer price data is available in Haver's USECON database while detailed figures can be found in the CPIDATA database.
The minutes of the latest FOMC meeting can be found here.
| Consumer Price Index (%) | September | August | Y/Y | 2008 | 2007 | 2006 |
|---|---|---|---|---|---|---|
| Total | 0.2 | 0.4 | -1.3 | 3.8 | 2.9 | 3.2 |
| Total less Food & Energy | 0.2 | 0.1 | 1.5 | 2.3 | 2.3 | 2.5 |
| Goods less Food & Energy | 0.3 | -0.3 | 1.6 | 0.1 | -0.4 | 0.2 |
| Services less Energy | 0.1 | 0.2 | 1.5 | 3.1 | 3.4 | 3.4 |
| Energy | 0.6 | 4.6 | -21.9 | 13.5 | 5.7 | 11.0 |
| Food & Beverages | -0.1 | 0.1 | -0.0 | 5.4 | 3.9 | 2.3 |
| Chained CPI: Total (NSA) | 0.1 | 0.2 | -1.4 | 3.3 | 2.5 | 2.9 |
| Total less Food & Energy | 0.2 | 0.1 | 1.1 | 2.0 | 2.0 | 2.2 |
U.S. Initial Unemployment Insurance Claims Fall Slightly; Continuing Claims Off As Well
by Tom Moeller October 15, 2009
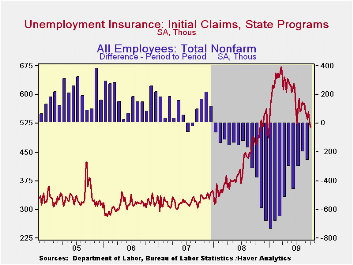 A recent
downtrend in initial claims for unemployment insurance continued last
week. They fell slightly and remained near their lowest level since
early-January. The Labor Department indicated that claims fell to
514,000 from an upwardly revised 524,000 during the prior week. Both
figures are down sharply from the peak reached in March of 674,000
claims. The latest figure was lower than Consensus expectations for
525,000 claims.
A recent
downtrend in initial claims for unemployment insurance continued last
week. They fell slightly and remained near their lowest level since
early-January. The Labor Department indicated that claims fell to
514,000 from an upwardly revised 524,000 during the prior week. Both
figures are down sharply from the peak reached in March of 674,000
claims. The latest figure was lower than Consensus expectations for
525,000 claims.
The largest decreases in initial claims during the week ending October 3 were in Florida (-5,178), California (-3,911), Tennessee (-683), Illinois (-682), and Arkansas (-589) while the largest increases in claims were in Pennsylvania (+3,618), Washington (+1,857), Wisconsin (+1,629), Missouri (+1,441), and Texas (+1,291).
Continuing claims for unemployment insurance during the latest
week
fell 75,000 to their lowest level since late-March.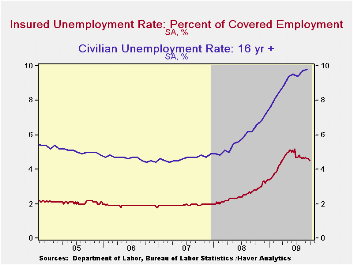 The decline
continues to owe partially to the exhaustion of benefits. Continuing
claims provide an indication of workers' ability to find employment.
The four-week average of continuing claims fell modestly to 6,082,750.
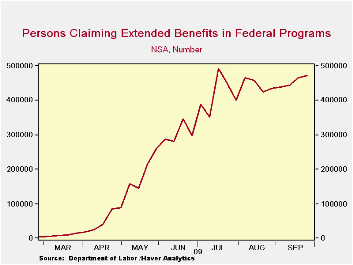
This series dates back to 1966. · Extended benefits
for unemployment insurance rose sharply for the fifth consecutive week.
Through the end of last month, extended benefits averaged 471,031.
The decline
continues to owe partially to the exhaustion of benefits. Continuing
claims provide an indication of workers' ability to find employment.
The four-week average of continuing claims fell modestly to 6,082,750.
This series dates back to 1966. · Extended benefits
for unemployment insurance rose sharply for the fifth consecutive week.
Through the end of last month, extended benefits averaged 471,031.
The insured rate of unemployment slipped to 4.5% and matched its lowest since early-April. The rate reached a high of 5.2% during late-June. During the last ten years, there has been a 93% correlation between the level of the insured unemployment rate and the overall rate of unemployment published by the Bureau of Labor Statistics.
 The lowest
rates were in North Dakota (1.0%), South Dakota (1.1),
Virginia (2.1), Wyoming (2.5), Maine (2.5), Texas (2.6), Colorado
(2.9), Minnesota (3.0), Maryland (3.1), Mississippi (3.5), New York
(3.5), Florida (3.8), and Georgia (3.9). The highest insured
unemployment rates in the week ending Sept. 26 were in Puerto Rico (7.1
percent), Oregon (5.3), Nevada (5.2), Pennsylvania (5.0), California
(4.7), Michigan (4.6), North Carolina (4.6), Wisconsin (4.6), Arkansas
(4.5), and South Carolina (4.5).
The lowest
rates were in North Dakota (1.0%), South Dakota (1.1),
Virginia (2.1), Wyoming (2.5), Maine (2.5), Texas (2.6), Colorado
(2.9), Minnesota (3.0), Maryland (3.1), Mississippi (3.5), New York
(3.5), Florida (3.8), and Georgia (3.9). The highest insured
unemployment rates in the week ending Sept. 26 were in Puerto Rico (7.1
percent), Oregon (5.3), Nevada (5.2), Pennsylvania (5.0), California
(4.7), Michigan (4.6), North Carolina (4.6), Wisconsin (4.6), Arkansas
(4.5), and South Carolina (4.5).
The unemployment insurance claims data is available in Haver's WEEKLY database and the state data is in the REGIONW database.
Yesterday's Senate testimony by Fed Governor Daniel K. Tarullo, State of the banking industry, can be found here.
| Unemployment Insurance (000s) | 10/09/09 | 10/02/09 | 09/26/09 | Y/Y | 2008 | 2007 | 2006 |
|---|---|---|---|---|---|---|---|
| Initial Claims | 514 | 524 | 554 | 9.6% | 420 | 321 | 313 |
| Continuing Claims | -- | 5,992 | 6,067 | 59.7% | 3,342 | 2,552 | 2,459 |
| Insured Unemployment Rate (%) | -- | 4.5 | 4.6 | 2.8 (10/2008) | 2.5 | 1.9 | 1.9 |
EMU HICP Drops in September Core Rate Remains in Subdued Trend
by Robert Brusca October 15, 2009
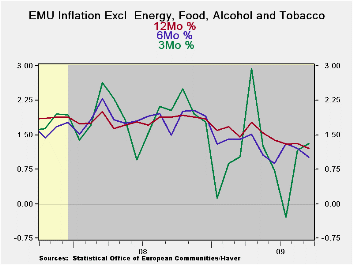
The EMU HICP fell by 0.1% m/m in September. The 12-month pace
for headline inflation was -0.3%. The headline rate has not increased
Yr/Yr since April. Headline inflation is choppy at a low level. Core
inflation has been very steady at a 1.1% pace; it barely ticked up to
1.2% over three months in Sept.
In EMU goods sector inflation has been falling under the influence of
weak oil prices aided by the impact of a rising euro exchange rate.
Services prices have been steady at 1.8% but over the recent three
months service sector inflation stepped down to a 1.3% pace.
The headline inflation trend across selected large EMU nations shows
subdued rates. Spain and France show a hint of inflation acceleration
in their sequential growth rates. Spain’s 1.9% 3-month pace is the
highest in this group.
Core inflation is both stable and low across the large EMU countries.
Italy alone shows some hint of acceleration with a core inflation pace
of 1.9% over three months up from what has generally been a 1.5% pace
for core inflation there.
On balance inflation, inflation trends inflation dynamics and inflation
fundamentals appear to be very well contained in the zone. We see the
inflation readings and trends above. The dynamics do not show wages or
prices getting out of control across the economy. The fundamentals show
constrained money and credit growth, lots of economic slack, as well as
a rising exchange rate. There is little ground for the ECB to be
inflation wary. The increases in global commodity prices have been well
blunted by euro strength Vs the dollar.
| Trends in HICP | |||||||
|---|---|---|---|---|---|---|---|
| % mo/mo | % SAAR | ||||||
| Sep-09 | Aug-09 | Jul-09 | 3-Mo | 6-Mo | 12-Mo | Yr Ago | |
| EMU | -0.1% | 0.5% | -0.3% | 0.8% | 0.8% | -0.3% | 3.6% |
| Core | 0.0% | 0.2% | 0.0% | 1.2% | 1.1% | 1.1% | 2.5% |
| Goods | 0.5% | 0.4% | -1.7% | -2.9% | -0.2% | -1.8% | 4.4% |
| Services | -0.7% | 0.2% | 0.8% | 1.3% | 1.8% | 1.8% | 2.6% |
| HICP | |||||||
| Germany | -0.3% | 0.7% | -0.5% | -0.4% | 0.4% | -0.5% | 3.0% |
| France | -0.1% | 0.5% | -0.1% | 1.1% | 0.7% | -0.4% | 3.4% |
| Italy | 0.4% | 0.5% | -0.6% | 1.1% | 1.5% | 0.4% | 3.9% |
| Spain | -0.3% | 0.7% | 0.1% | 1.9% | 1.4% | -1.0% | 4.6% |
| Core excl Food Energy and Alcohol | |||||||
| Germany | -0.2% | 0.4% | 0.1% | 1.1% | 1.3% | 1.0% | 1.7% |
| France | -0.1% | 0.3% | 0.1% | 0.8% | 1.0% | 1.2% | 2.3% |
| Italy | 0.4% | 0.5% | -0.4% | 1.9% | 1.5% | 1.5% | 3.0% |
| Spain | -0.1% | 0.1% | 0.2% | 0.7% | 0.7% | 0.3% | 3.4% |
Philadelphia Fed Index Slips Yet Still Indicates Positive Growth
by Tom Moeller October 15, 2009
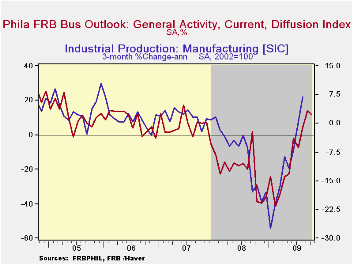 October
index of factory sector activity from the Philadelphia Federal Reserve
Bank indicated that activity in the region continued to grow this
month. The index slipped as expected to a positive 11.5 from 14.1 in
September and remained near its highest since mid-2007. The latest
level compared to figures near -40.0 this past fall and winter.
October
index of factory sector activity from the Philadelphia Federal Reserve
Bank indicated that activity in the region continued to grow this
month. The index slipped as expected to a positive 11.5 from 14.1 in
September and remained near its highest since mid-2007. The latest
level compared to figures near -40.0 this past fall and winter.
During
the last ten years there has been a 77% correlation between the level
of the Philadelphia Fed Business Conditions Index and the three-month
growth in factory sector industrial production.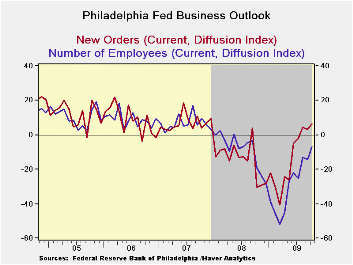 There has been a 70%
correlation with q/q growth in real GDP. The latest survey from the
Philadelphia Federal Reserve Bank can be found here.·
Amongst the components, new orders improved to 6.2 from 3.3 and the
latest figure was the highest since 2007. Also showing improvement was
the employment index. It rose to a still negative -6.8 but that
compared with a low of -52.0 during March. During the last ten years
there has been a 79% correlation between the index level and the m/m
change in manufacturing sector payrolls. The inventory component
reversed its earlier improvement and suggests that any turn towards
inventory accumulation will be modest.
There has been a 70%
correlation with q/q growth in real GDP. The latest survey from the
Philadelphia Federal Reserve Bank can be found here.·
Amongst the components, new orders improved to 6.2 from 3.3 and the
latest figure was the highest since 2007. Also showing improvement was
the employment index. It rose to a still negative -6.8 but that
compared with a low of -52.0 during March. During the last ten years
there has been a 79% correlation between the index level and the m/m
change in manufacturing sector payrolls. The inventory component
reversed its earlier improvement and suggests that any turn towards
inventory accumulation will be modest.
Improved pricing power
accompanied the gains in real activity. The prices paid index rose to
its highest level since last September and compares to negative
readings this past winter and spring. During the last ten years there
has been a 74% correlation between the prices paid index and the
three-month growth in the intermediate goods PPI.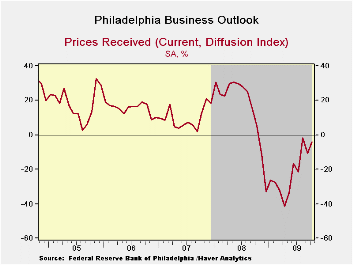 There has been an 83%
correlation with the change in core intermediate goods prices.
There has been an 83%
correlation with the change in core intermediate goods prices.
Expected business conditions in six months fell this month. The October index fell to a still-positive reading of 39.8 but that was down from the recent high. Most of the index components fell except anticipated capital expenditures.· The figures from the Philadelphia Federal Reserve can be found in Haver's SURVEYS database.
| Philadelphia Fed (%) | October | September | October '08 | 2008 | 2007 | 2006 |
|---|---|---|---|---|---|---|
| General Activity Index | 11.5 | 14.1 | -38.7 | -21.3 | 5.0 | 8.0 |
| New Orders | 6.2 | 3.3 | -30.6 | -14.7 | 6.9 | 9.0 |
| Number of Employees | -6.8 | -14.3 | -19.2 | -8.7 | 6.8 | 9.0 |
| Prices Paid Index | 21.3 | 14.9 | 10.2 | 36.4 | 26.3 | 36.7 |
Empire State Factory Conditions Improve To Highest Level Since 2004
by Tom Moeller October 15, 2009
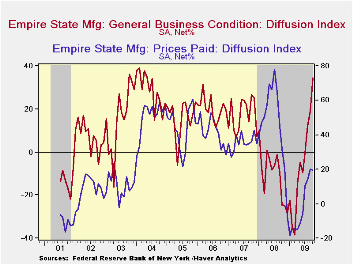
The Federal Reserve Bank of New York reported that its October Empire State Factory Index of General Business Conditions improved to its highest level since 2004. The latest reading of 34.57 compares to sharply negative levels this past Winter and suggests positive growth in factory sector activity. The latest level was much better than Consensus expectations for a reading of 18.0.
The figure is a diffusion index. Since the series' inception in 2001, there has been a 75% correlation between its level and the three-month change in U.S. factory sector industrial production. Like the Philadelphia Fed Index of General Business Conditions, the Empire State Business Conditions Index reflects answers to independent survey questions; it is not a weighted combination of the components. The series dates back only to 2001.
The Empire State Manufacturing Survey is a monthly survey of manufacturers in New York State. Participants from across the state in a variety of industries respond to a questionnaire and report the change in indicators from the previous month. Respondents also state the likely direction of these same indicators six months ahead. For more on the Empire State Manufacturing Survey, including methodologies and the latest report, click here.
The new orders component again paced the latest gain in the
overall October index with a rise to the highest level since 2005. The
shipments index also improved sharply while the employment index
reached its highest level since 2007. In the history of the NY
employment index, there has been an 87% correlation between the
employment index and the three-month growth in overall U.S. factory
sector employment as reported by the Labor Department. The workweek
index also improved sharply as did unfilled orders and delivery times.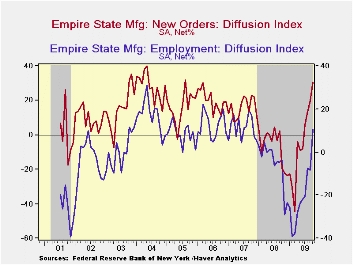
The price index eased slightly after having risen to its highest level in a year during September. Nevertheless, the index level remained down sharply from all of last year. Since inception in 2001, there has been a 77% correlation between the index of prices paid and the three-month change in the core intermediate materials PPI.
The Empire State index of expected business conditions in six months rose during August to its highest level since early 2007. The subseries for new orders, shipments, employment and capital expenditures each ticked up.
The Empire State data is available in Haver's SURVEYS database.
| Empire State Manufacturing Survey | October | September | October '08 | 2008 | 2007 | 2006 |
|---|---|---|---|---|---|---|
| General Business Conditions (diffusion index, %) | 34.57 | 18.88 | -24.30 | -10.10 | 17.23 | 20.24 |
| New Orders | 30.82 | 19.84 | -19.57 | -6.25 | 15.71 | 20.11 |
| Employment | 10.39 | -8.33 | -3.66 | -5.36 | 11.28 | 12.62 |
| Prices Paid | 19.48 | 20.24 | 31.71 | 46.99 | 35.64 | 41.88 |

Tom Moeller
AuthorMore in Author Profile »Prior to joining Haver Analytics in 2000, Mr. Moeller worked as the Economist at Chancellor Capital Management from 1985 to 1999. There, he developed comprehensive economic forecasts and interpreted economic data for equity and fixed income portfolio managers. Also at Chancellor, Mr. Moeller worked as an equity analyst and was responsible for researching and rating companies in the economically sensitive automobile and housing industries for investment in Chancellor’s equity portfolio. Prior to joining Chancellor, Mr. Moeller was an Economist at Citibank from 1979 to 1984. He also analyzed pricing behavior in the metals industry for the Council on Wage and Price Stability in Washington, D.C. In 1999, Mr. Moeller received the award for most accurate forecast from the Forecasters' Club of New York. From 1990 to 1992 he was President of the New York Association for Business Economists. Mr. Moeller earned an M.B.A. in Finance from Fordham University, where he graduated in 1987. He holds a Bachelor of Arts in Economics from George Washington University.
More Economy in Brief


