 Global| Aug 14 2009
CPI Decline Revisits 1950 As CorePrice Gain Slows To Smallest Since 2004
by:Tom Moeller
|in:Economy in Brief
Summary
Deflation is much too strong a word to describe all of the pieces of the current pricing environment, but it appropriately denotes the CPI total and some of its components. Last month, the CPI matched Consensus expectations and was [...]
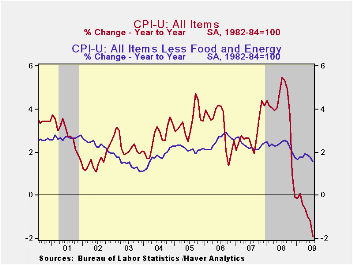 Deflation is
much too strong a word to describe all of the pieces of the current
pricing environment, but it appropriately denotes the CPI total and
some of its components. Last month, the CPI matched Consensus
expectations and was unchanged from June. More to the point, versus
June of last year, the 1.9% decline again was the largest since
early-1950. Stripping out food & energy, prices rose an
expected 0.1% which lessened the y/y gain to 1.6%, its least since
early 2004.
Deflation is
much too strong a word to describe all of the pieces of the current
pricing environment, but it appropriately denotes the CPI total and
some of its components. Last month, the CPI matched Consensus
expectations and was unchanged from June. More to the point, versus
June of last year, the 1.9% decline again was the largest since
early-1950. Stripping out food & energy, prices rose an
expected 0.1% which lessened the y/y gain to 1.6%, its least since
early 2004.
The 0.4% decline in energy prices reversed a small piece of the June jump and left them down by more than one-quarter from the year-ago level. Gasoline prices slipped 0.8% (-37.3% y/y) after a 17.3% jump during June. Fuel oil prices also reversed roughly half of their June rise with a 1.1% (-41.8% y/y) drop. Finally, prices for natural gas & electricity slipped 0.3% (-11.7% y/y).
Food & beverage prices also provided some price relief with a 0.2% decline which was the fifth this year. That lowered the y/y increase to 1.0% which was the lowest since late-2002 and down from the peak 6.1% rate of increase last fall. Recent weakness has been led by lower dairy prices (-9.7% y/y) and lower fruit & vegetable (-3.4% y/y) prices. Prices for meats, poultry & fish also fell by 1.7% y/y while cereals & bakery product prices rose just 1.2%.
The CPI less food & energy also has been well behaved. The expected 0.1% July increase slowed the y/y gain to 1.6% which was its least since early-2004. Of some note, however, is that prices increased at an accelerated 2.1% rate since December of last year. That's only slightly below the 2.3% rates of increase during the last two years.
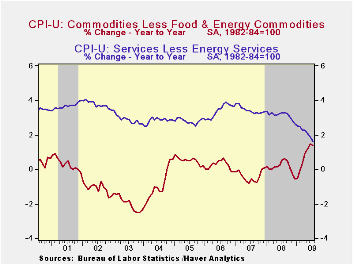 This year,
core goods prices indeed
have firmed some. They rose 0.2% last month and at a 3.8% annualized
rate so far this year. That compares with little price change during
the prior three years. Again, higher tobacco prices account for much of
that acceleration. As taxes have been raised, prices jumped 2.2% last
month and so far this year at a 49.8% annual rate. There also has been
modest firming of prices elsewhere. Apparel prices posted a 0.6%
increase and are up at a 3.9% rate this year after price declines which
extend back to 1994 (no typo). Prices for new & used motor
vehicles also seemed to strengthen despite an aggressive marketing
campaign. They rose 0.3% last month and at a 4.1% rate this year. That
compares with price deflation during the last two years. Continuing
weak were prices for household furnishings & operation. They
slipped 0.1% during July and the 0.5% YTD rate of increase about
matches the gain during 2008.
This year,
core goods prices indeed
have firmed some. They rose 0.2% last month and at a 3.8% annualized
rate so far this year. That compares with little price change during
the prior three years. Again, higher tobacco prices account for much of
that acceleration. As taxes have been raised, prices jumped 2.2% last
month and so far this year at a 49.8% annual rate. There also has been
modest firming of prices elsewhere. Apparel prices posted a 0.6%
increase and are up at a 3.9% rate this year after price declines which
extend back to 1994 (no typo). Prices for new & used motor
vehicles also seemed to strengthen despite an aggressive marketing
campaign. They rose 0.3% last month and at a 4.1% rate this year. That
compares with price deflation during the last two years. Continuing
weak were prices for household furnishings & operation. They
slipped 0.1% during July and the 0.5% YTD rate of increase about
matches the gain during 2008.
The U.S. recession continued to lower
the strength of core services prices. They were
unchanged last month and have risen at just a 1.5% annual rate so far
this year, half that in 2008 and nearly the weakest since
1983. Weakness in the housing market accounts for much of that
moderation. Last month, shelter prices fell 0.2% and they've risen at a
just a 0.6% annual rate so far in 2009. Owners equivalent rent of
primary residences, a measure not equivalent to other house price
measures, dipped slightly during July and have risen at a 1.6% rate so
far this year versus a 2.5% 2008 increase.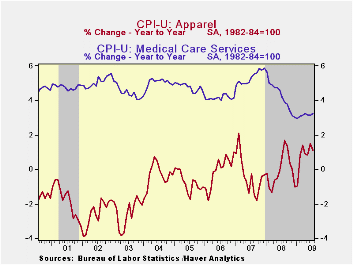 Elsewhere, public
transportation prices posted a 1.9% rebound last month after earlier
declines but they're down at an 8.3% rate this year. Also
firming last month were medical care services prices with a 0.3%
increase and 3.6% YTD gain. Education costs have been firm. They are up
at a 5.5% annual rate this year.
Elsewhere, public
transportation prices posted a 1.9% rebound last month after earlier
declines but they're down at an 8.3% rate this year. Also
firming last month were medical care services prices with a 0.3%
increase and 3.6% YTD gain. Education costs have been firm. They are up
at a 5.5% annual rate this year.
The chained CPI, which adjusts for shifts in consumption patterns, fell 0.2% during July while year-to-year prices fell 1.9%. Chained prices less food and energy were roughly unchanged last month for the third month in a row but the YTD change of 2.2% is up sharply from no change as of the end of last year.
The consumer price data is available in Haver's USECON database while detailed figures can be found in the CPIDATA database.
| Consumer Price Index (%) | July | June | Y/Y | 2008 | 2007 | 2006 | |
|---|---|---|---|---|---|---|---|
| Total | 0.0 | 0.7 | -1.9 | 3.8 | 2.9 | 3.2 | |
| Total less Food & Energy | 0.1 | 0.2 | 1.6 | 2.3 | 2.3 | 2.5 | |
| Goods less Food & Energy | 0.2 | 0.3 | 1.4 | 0.1 | -0.4 | 0.2 | |
| Services less Energy | 0.0 | 0.1 | 1.6 | 3.1 | 3.4 | 3.4 | |
| Energy | -0.4 | 7.4 | -28.0 | 13.5 | 5.7 | 11.0 | |
| Food & Beverages | -0.2 | 0.1 | 1.0 | 5.4 | 3.9 | 2.3 | |
| Chained CPI: Total (NSA) | 0.9 | -1.3 | 3.3 | 2.5 | 2.9 | ||
| Total less Food & Energy | 0.0 | 1.3 | 2.0 | 2.0 | 2.2 | ||
by Robert Brusca August 14, 2009
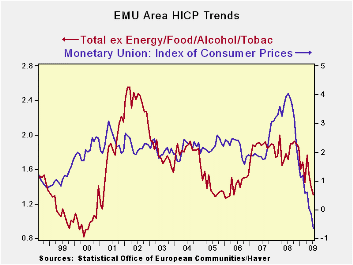
The EMU HICP fell by a larger than expected 0.7% Yr/Yr. But with France and Germany emerging from recession in yesterday’s GDP reports, markets are not focused on inflation being under control or worried about deflation with the Yr/Yr drop, but instead worried that inflation is going to be a problem sooner rather than later. Isn’t that just like markets? Nothing is what is seems.
Forecasts made up to this point have been assuming that Europe was going to remain weak for some time. Now with the early exit from recession by Germany and France and the small drop in EMU GDP in 2009-Q2, inflation forecasts are beginning to get a re-think.
Ex food and energy inflation in EMU is at +0.6%. The core measure of inflation was flat in July, up by 0.1% in June and flat in May. There isn’t exactly any news saying inflation is building momentum here.
Moreover, although Germany and France have ‘existed recession’ they have done so in a most peculiar way. And before calling it the ‘end of recession’ perhaps we should wait and see what has been cooked into its GDP stew. As we pointed out in the write–up of European GDP yesterday, the diffusion indicators that track the various sectors across European nations and in EMU are still at very depressed levels. This has to conjure up concerns of what ether GDP rose upon in Q2 and if those fumes will still have lifting force in 2009-Q3.
In short, it seems a bad time to start to raise inflation forecasts and fears. The EMU-wide HICP is in a strong drop; it is not covering for any inflation under the surface and the surprising growth served up by several European economies is equally surprising after the fact as we try to understand it. Is that real and is it really a basis for concerns about STRONG growth?
The bottom line is that inflation is under control in Europe and barring something exceptional - that we have not yet seen -- it should stay that way.
| Trends in HICP | |||||||
|---|---|---|---|---|---|---|---|
| % Mo/Mo | % Saar | ||||||
| Jul-09 | Jun-09 | May-09 | 3-Mo | 6-Mo | 12-Mo | Yr Ago | |
| EMU | -0.3% | 0.3% | 0.0% | -0.2% | 0.2% | -0.7% | 4.0% |
| Core | 0.0% | 0.1% | 0.0% | 0.6% | 1.3% | 1.2% | 2.5% |
| Goods | -1.7% | 0.2% | 0.1% | -5.5% | -0.1% | -2.4% | 5.1% |
| Services | 0.8% | 0.1% | 0.1% | 4.1% | 3.7% | 1.9% | 2.6% |
| HICP | |||||||
| Germany | -0.5% | 0.5% | -0.2% | -0.7% | -0.2% | -0.7% | 3.5% |
| France | -0.1% | 0.2% | 0.0% | 0.3% | 0.3% | -0.8% | 4.0% |
| Italy | -0.6% | 0.3% | 0.0% | -1.1% | 0.7% | -0.1% | 4.1% |
| Spain | 0.1% | 0.4% | -0.1% | 1.7% | 0.3% | -1.4% | 5.3% |
| Core:xFE&A | |||||||
| Germany | 0.1% | 0.2% | -0.1% | 0.8% | 1.7% | 1.1% | 1.8% |
| Italy | -0.4% | 0.1% | 0.1% | -0.7% | 1.3% | 1.3% | 2.8% |
| Spain | 0.2% | 0.2% | 0.0% | 1.3% | 0.5% | 0.7% | 3.5% |
by Tom Moeller August 14, 2009
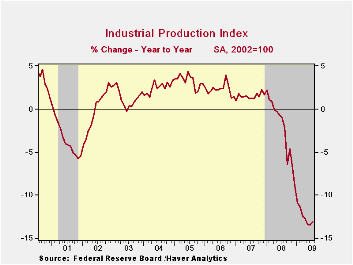
A consistent indicator of turning points in the U.S. economy has been industrial output. And last month it signaled growth. Industrial output, which includes mining and utilities, rose a greater-than-expected 0.5% during July after an unrevised 0.4% June decline. More important for recession timing, perhaps, was that factory output increased for the first month since December of 2006. This call still is not a sure thing, however, because of the industry composition of the gain.
Output of consumer goods overall jumped 0.7% during July led by a 17.3% surge in auto production (-22.2% y/y). But that's only a partial indication of a change from the widespread downward momentum in industry output. Furniture & appliance output slipped 0.1% (-22.3% y/y) as consumers continued to defer purchases of large durable goods. Consumer nondurables output fell 0.9% with a decline in chemical products products production but output of business equipment rose 0.5% (-17.3% y/y. The output of construction supplies slipped 0.1% (-20.9% y/y).
In the the high-tech sector the rate of decline in output also has slowed. Industrial production of high tech equipment slipped 0.1% last month. Less high tech, manufacturing industrial production jumped 1.0% last month and the annual rate of change eased to -9.8% over the last seven months. Outside of the auto and high-tech sectors together, output rose 0.1% for the first increase since last October.
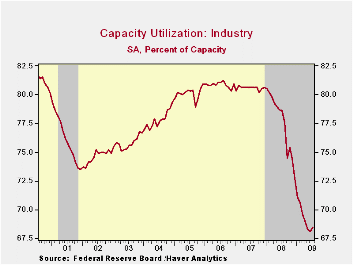
Excess capacity diminshed slightly with the rise in production. Capacity utilization rose from its record low to 68.5%. The series dates back to 1966. Utilization in the factory sector also improved to 65.4%, still down from a peak near 80% back in 2007.
The industrial production data are available in Haver's USECON database.
| INDUSTRIAL PRODUCTION (SA, %) | July | June | Y/Y | 2008 | 2007 | 2006 |
|---|---|---|---|---|---|---|
| Total Output | 0.5 | -0.4 | -13.0 | -2.2 | 1.5 | 2.3 |
| Manufacturing | 1.0 | -0.5 | -14.4 | -3.2 | 1.4 | 2.5 |
| Consumer Goods | 0.7 | -0.6 | -7.2 | -2.6 | 0.9 | 0.4 |
| Business Equipment | 0.5 | -0.7 | -17.3 | -1.1 | 2.7 | 9.4 |
| Construction Supplies | -0.1 | -0.4 | -20.9 | -6.3 | -2.0 | 2.3 |
| Utilities | -2.5 | 0.9 | -4.9 | 0.3 | 3.4 | -0.6 |
| Capacity Utilization | 68.5 | 68.1 | 78.6 (July '08) | 77.6 | 80.6 | 80.9 |
by Tom Moeller August 14, 2009
A consistent indicator of turning points in the U.S. economy has been industrial output. And last month it signaled growth. Industrial output, which includes mining and utilities, rose a greater-than-expected 0.5% during July after an unrevised 0.4% June decline. More important for recession timing, perhaps, was that factory output increased for the first month since December of 2006. This call still is not a sure thing, however, because of the industry composition of the gain.
Output of consumer goods overall jumped 0.7% during July led by a 17.3% surge in auto production (-22.2% y/y). But that's only a partial indication of a change from the widespread downward momentum in industry output. Furniture & appliance output slipped 0.1% (-22.3% y/y) as consumers continued to defer purchases of large durable goods. Consumer nondurables output fell 0.9% with a decline in chemical products products production but output of business equipment rose 0.5% (-17.3% y/y. The output of construction supplies slipped 0.1% (-20.9% y/y).
In the the high-tech sector the rate of decline in output also has slowed. Industrial production of high tech equipment slipped 0.1% last month. Less high tech, manufacturing industrial production jumped 1.0% last month and the annual rate of change eased to -9.8% over the last seven months. Outside of the auto and high-tech sectors together, output rose 0.1% for the first increase since last October.
Excess capacity diminshed slightly with the rise in production. Capacity utilization rose from its record low to 68.5%. The series dates back to 1966. Utilization in the factory sector also improved to 65.4%, still down from a peak near 80% back in 2007.
The industrial production data are available in Haver's USECON database.
| INDUSTRIAL PRODUCTION (SA, %) | July | June | Y/Y | 2008 | 2007 | 2006 |
|---|---|---|---|---|---|---|
| Total Output | 0.5 | -0.4 | -13.0 | -2.2 | 1.5 | 2.3 |
| Manufacturing | 1.0 | -0.5 | -14.4 | -3.2 | 1.4 | 2.5 |
| Consumer Goods | 0.7 | -0.6 | -7.2 | -2.6 | 0.9 | 0.4 |
| Business Equipment | 0.5 | -0.7 | -17.3 | -1.1 | 2.7 | 9.4 |
| Construction Supplies | -0.1 | -0.4 | -20.9 | -6.3 | -2.0 | 2.3 |
| Utilities | -2.5 | 0.9 | -4.9 | 0.3 | 3.4 | -0.6 |
| Capacity Utilization | 68.5 | 68.1 | 78.6 (July '08) | 77.6 | 80.6 | 80.9 |
by Tom Moeller August 14, 2009
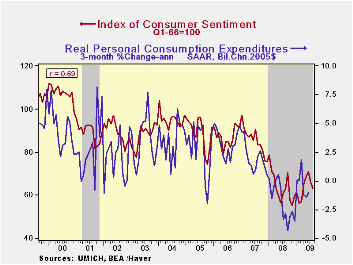 Worries
about personal finances and the shape of the U.S. economy persisted
this month. The University of Michigan's early-August reading of
consumer sentiment fell to 63.2 from 66.0 during July and was down for
the third consecutive month. Moreover, sentiment was at its lowest
level since March. Consensus expectations had been for a firmer August
reading of 69.0. During the last ten years, there has been a 69%
correlation between the level of sentiment and the growth in real
consumer spending during the next five months.
Worries
about personal finances and the shape of the U.S. economy persisted
this month. The University of Michigan's early-August reading of
consumer sentiment fell to 63.2 from 66.0 during July and was down for
the third consecutive month. Moreover, sentiment was at its lowest
level since March. Consensus expectations had been for a firmer August
reading of 69.0. During the last ten years, there has been a 69%
correlation between the level of sentiment and the growth in real
consumer spending during the next five months.
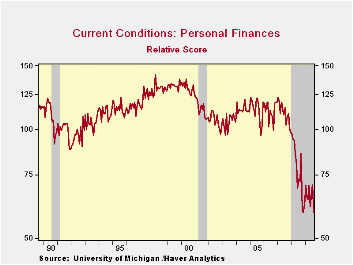
The reading of current
economic conditions fell the hardest this month with a 7.9% drop which
was double the July decline. The reading of current personal finances
fell quite hard m/m as employment & income weakness lagged the
stock market's improvement. In fact, the level of the reading
was at a record low.  Also within the current conditions index
was a decline in buying conditions for large household goods to the
lowest level since April.
Also within the current conditions index
was a decline in buying conditions for large household goods to the
lowest level since April.
The expectations component of the sentiment index also fell this month. It posted a moderate 1.7% decline after the 8.7% July drop. But still the index up y/y. Expectations for personal finances fell, down for the third month in four (+1.9% y/y). Expected business conditions during the next year also fell for the second month in three but expectations for conditions during the next five years ticked higher (+6.9% y/y). Inflation expectations for the next year fell sharply to 2.9% which was the lowest level since March. That compares to a low of 1.7% last December but remained down from a reading which was as high as 7.0% during May of last year.
 The opinion
of government policy, which may eventually influence economic
expectations, fell for the third straight month to its lowest level
since February. An increased 36% of respondents thought that a poor job
was being done by government while a reduced 17% thought that a good
job was being done.
The opinion
of government policy, which may eventually influence economic
expectations, fell for the third straight month to its lowest level
since February. An increased 36% of respondents thought that a poor job
was being done by government while a reduced 17% thought that a good
job was being done.
The University of Michigan survey data is not seasonally adjusted. The reading is based on telephone interviews with about 500 households at month-end; the mid-month results are based on about 300 interviews. The summary indexes are in Haver's USECON database with details in the proprietary UMSCA database.
| University of Michigan | Mid-August | July | June | Aug y/y | 2008 | 2007 | 2006 |
|---|---|---|---|---|---|---|---|
| Consumer Sentiment | 63.2 | 66.0 | 70.8 | 0.3% | 63.8 | 85.6 | 87.3 |
| Current Conditions | 64.9 | 70.5 | 73.2 | -8.6 | 73.7 | 101.2 | 105.1 |
| Expectations | 62.1 | 63.2 | 69.2 | 7.3 | 57.3 | 75.6 | 75.9 |

Tom Moeller
AuthorMore in Author Profile »Prior to joining Haver Analytics in 2000, Mr. Moeller worked as the Economist at Chancellor Capital Management from 1985 to 1999. There, he developed comprehensive economic forecasts and interpreted economic data for equity and fixed income portfolio managers. Also at Chancellor, Mr. Moeller worked as an equity analyst and was responsible for researching and rating companies in the economically sensitive automobile and housing industries for investment in Chancellor’s equity portfolio. Prior to joining Chancellor, Mr. Moeller was an Economist at Citibank from 1979 to 1984. He also analyzed pricing behavior in the metals industry for the Council on Wage and Price Stability in Washington, D.C. In 1999, Mr. Moeller received the award for most accurate forecast from the Forecasters' Club of New York. From 1990 to 1992 he was President of the New York Association for Business Economists. Mr. Moeller earned an M.B.A. in Finance from Fordham University, where he graduated in 1987. He holds a Bachelor of Arts in Economics from George Washington University.
More Economy in Brief


