 Global| Mar 21 2002
Consumer Prices Rose Expected 0.2%
by:Tom Moeller
|in:Economy in Brief
Summary
Consumer prices overall rose about as expected last month. Core inflation rose slightly more than the 0.2% Consensus expectation. The modest surprise in core inflation was due to no change in consumer goods prices versus deflation [...]

Consumer prices overall rose about as expected last month. Core inflation rose slightly more than the 0.2% Consensus expectation.
The modest surprise in core inflation was due to no change in consumer goods prices versus deflation during the prior two months. A 3.8% rise in tobacco prices led this firming. Apparel prices also rose 0.5% after falling during the three prior months. Home furnishing and new vehicle prices fell.
Services prices less energy rose 0.4%, about the same as during the prior three months. Shelter prices rose 0.5% (4.3% y/y) while medical care services rose just 0.2% (4.6% y/y). Public transportation prices fell (-2.3% y/y).
Energy prices reversed most of the January rise due to lower prices for gasoline, fuel oil and natural gas & electricity.
| Consumer Price Index | Feb | Jan | Y/Y | 2001 | 2000 | 1999 |
|---|---|---|---|---|---|---|
| Total | 0.2% | 0.2% | 1.1% | 2.8% | 3.4% | 2.2% |
| Total less Food & Energy | 0.3% | 0.2% | 2.5% | 2.7% | 2.4% | 2.1% |
| Goods less Food & Energy | 0.0% | -0.3% | -0.9% | 0.3% | 0.5% | 0.7% |
| Services less Energy | 0.4% | 0.4% | 4.1% | 3.7% | 3.3% | 2.7% |
| Energy | -0.8% | 0.9% | -15.6% | 3.7% | 16.9% | 3.6% |
| Food & Beverages | 0.2% | 0.3% | 2.6% | 3.1% | 2.3% | 2.1% |
by Tom Moeller March 21, 2002

Initial claims for unemployment insurance fell about as expected from the prior week's level that was revised up slightly. The latest figure is for the survey week for nonfarm payrolls. Claims were up slightly from the February survey period.
Initial claims have fluctuated between 360,000 and 390,000 since mid-January.
There has been an 82% correlation between the level of initial claims and the 3-month change in nonfarm payrolls.
The four-week moving average of claims rose slightly to 379,000.
Continuing claims for unemployment insurance rose slightly in the latest week but the prior week's level was revised down.
The insured rate of unemployment rose slightly to 2.7%, about where it's been all year.
| Unemployment Insurance (000s) | 03/16/02 | 03/09/02 | Y/Y | 2001 | 2000 | 1999 |
|---|---|---|---|---|---|---|
| Initial Claims | 371.0 | 383.0 | -2.9% | 408.0 | 302.8 | 297.7 |
| Continuing Claims | -- | 3,465 | 40.7% | 3,031 | 2,127 | 2,187 |
by Tom Moeller March 21, 2002
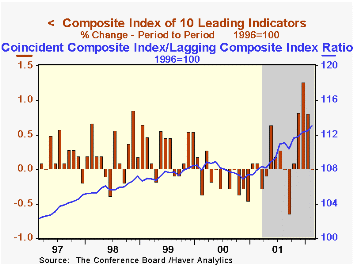
The Composite Index of Leading Economic Indicators was unchanged last month, about as expected. January's increase was revised up from 0.6%.
55% of the component series contributed to the increase, the narrowest breadth-of-gain since September. The six-month diffusion index improved to 60%, its highest since January 2000.
The money supply had the largest positive contribution to the leader's rise while lower stock prices had largest negative effect.
The Leading index is based on eight previously reported economic data series and two that are estimated.
| Business Cycle Indicators | Feb | Jan | Y/Y | 2001 | 2000 | 1999 |
|---|---|---|---|---|---|---|
| Leading | 0.0% | 0.8% | 3.1% | -0.6% | 1.0% | 3.3% |
| Coincident | 0.2% | 0.0% | -0.6% | 0.3% | 3.4% | 3.2% |
| Lagging | -0.3% | -0.2% | -5.1% | -1.3% | 2.8% | 1.8% |
by Tom Moeller March 21, 2002
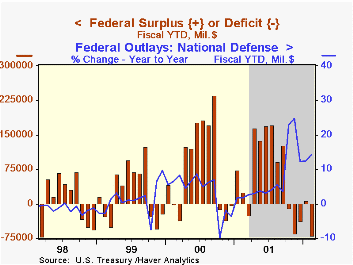
The US budget deficit surged in February pulling the fiscal year-to-date balance to its worst first five months level since 1997.
Receipts fell sharply. Fiscal YTD individual income taxes are down 7.3% versus last year, reflecting higher unemployment.
Growth in expenditures surged lifted by higher spending on defense, education and income security.
| US Government Finance | Feb | Jan | Fiscal YTD | 2001 | 2000 | 1999 |
|---|---|---|---|---|---|---|
| Budget Balance | $-76.1B | $43.7B | $-69.4B | $127.2B | $236.9B | $124.4B |
| Revenues | -51.9% | 8.3% | -3.0% | -1.7% | 10.8% | 6.1% |
| Outlays | 8.9% | -1.0% | 9.7s% | 4.2% | 5.0% | 3.1% |
by Tom Moeller March 21, 2002

The Philadelphia Fed’s index of general business conditions fell as expected. Nevertheless, the index remained positive for the third month following more than a year of negative readings.
New orders and delivery lead times were down. Inventories fell but at a lesser rate.
The business conditions index reflects a separate survey question, not the components.
Inflation pressure was positive for the first month since last June.
| Philadelphia Fed Business Outlook | Mar | Feb | Y/Y | 2001 | 2000 | 1999 |
|---|---|---|---|---|---|---|
| General Activity Index | 11.4 | 16.0 | -20.1 | -17.3 | 8.2 | 13.3 |
| Prices Paid Index | 3.0 | -4.5 | 14.0 | -1.0 | 27.1 | 10.0 |

Tom Moeller
AuthorMore in Author Profile »Prior to joining Haver Analytics in 2000, Mr. Moeller worked as the Economist at Chancellor Capital Management from 1985 to 1999. There, he developed comprehensive economic forecasts and interpreted economic data for equity and fixed income portfolio managers. Also at Chancellor, Mr. Moeller worked as an equity analyst and was responsible for researching and rating companies in the economically sensitive automobile and housing industries for investment in Chancellor’s equity portfolio. Prior to joining Chancellor, Mr. Moeller was an Economist at Citibank from 1979 to 1984. He also analyzed pricing behavior in the metals industry for the Council on Wage and Price Stability in Washington, D.C. In 1999, Mr. Moeller received the award for most accurate forecast from the Forecasters' Club of New York. From 1990 to 1992 he was President of the New York Association for Business Economists. Mr. Moeller earned an M.B.A. in Finance from Fordham University, where he graduated in 1987. He holds a Bachelor of Arts in Economics from George Washington University.
More Economy in Brief


