 Global| Apr 21 2006
Consumer Prices in Asia
Summary
The inflation picture in Asia is harder to interpret than that in Europe because the economies have such different structures and the data collection and definitions are less standardized. Three countries reporting today for March [...]
The inflation picture in Asia is harder to interpret than that in Europe because the economies have such different structures and the data collection and definitions are less standardized. Three countries reporting today for March show widely varying patterns of consumer price behavior.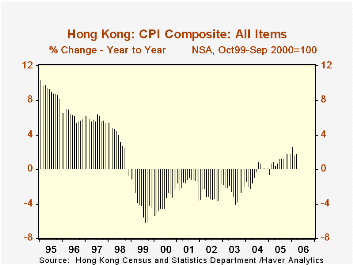
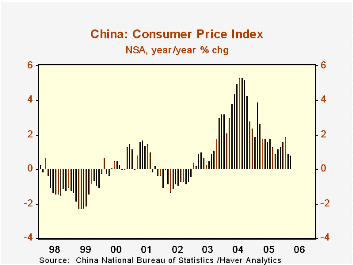
In China, the overall CPI trend shows quite modest gains over the last couple of months, and inflation has definitely slowed from a couple of years ago. Prices of household goods and services are headed higher, which may reflect heating costs, and clothing price changes are distinctly less negative than before. But tobacco and alcohol products, recreation and culture and shelter are slowing down. These outweigh the firming tendencies, so, at just 0.8% year-to-year in March, total CPI inflation in China is the lowest since mid-2003.
In Hong Kong, consumer prices have turned up after a period of outright deflation from 1999 through mid-2004. This too may be energy related as transportation and housing costs are the main movers. Clothing and alcohol and tobacco, though, are exerting downward pressure and durable goods prices are maintaining a steady downward trend at about a 2.5% annual rate. So, while inflation has returned in Hong Kong, it seems to be sustained at a quite moderate pace.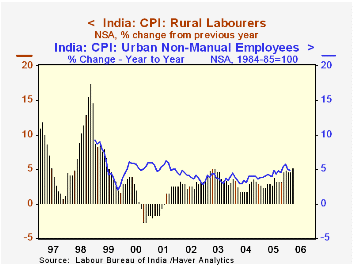
India encompasses at least two completely different economies, the urban sector and the rural. Inflation in both is presently about equal, however, with the CPI for rural laborers running at 5.3%, year-on-year, in March and 4.7% in February; this follows 4.9% in 2005 and is considerably higher than the 3% range that prevailed in prior years. The current pace is similar for "urban non-manual employees", at 4.8% in February, although off somewhat from the 5.7% rate for 2005. While we might be concerned over the seemingly rapid pace of Indian inflation at present, it compares quite favorably with 7%-10% rates during the 1980s and 1990s.
These data are all found in Haver's EMERGEPR database, which we maintain directly from country sources. Regional data for China are carried in the premium CHINA database which we market from CEIC, prominent economic consultants in Asia.
| Yr/Yr % Change, NSA | Mar 2006 | Feb 2006 | Jan 2006 | December/December||||
|---|---|---|---|---|---|---|---|
| 2005 | 2004 | 2003 | 2002 | ||||
| China | 0.8 | 0.9 | 1.9 | 1.6 | 2.4 | 3.2 | -0.6 |
| Hong Kong | 1.8 | 1.6 | 2.6 | 1.8 | 0.2 | -1.9 | -1.6 |
| India: Rural Laborers | 5.3 | 4.7 | 4.7 | 4.9 | 3.0 | 3.1 | 3.2 |
| India: Urban Non-Manual Employees | -- | 4.8 | 5.0 | 5.7 | 3.6 | 4.0 | 2.8 |
Carol Stone, CBE
AuthorMore in Author Profile »Carol Stone, CBE came to Haver Analytics in 2003 following more than 35 years as a financial market economist at major Wall Street financial institutions, most especially Merrill Lynch and Nomura Securities. She had broad experience in analysis and forecasting of flow-of-funds accounts, the federal budget and Federal Reserve operations. At Nomura Securities, among other duties, she developed various indicator forecasting tools and edited a daily global publication produced in London and New York for readers in Tokyo. At Haver Analytics, Carol was a member of the Research Department, aiding database managers with research and documentation efforts, as well as posting commentary on select economic reports. In addition, she conducted Ways-of-the-World, a blog on economic issues for an Episcopal-Church-affiliated website, The Geranium Farm. During her career, Carol served as an officer of the Money Marketeers and the Downtown Economists Club. She had a PhD from NYU's Stern School of Business. She lived in Brooklyn, New York, and had a weekend home on Long Island.


