 Global| Oct 31 2006
Consumer Confidence Eased
by:Tom Moeller
|in:Economy in Brief
Summary
Consumer confidence in October eased 0.5% to 105.4 following an upwardly revised 5.7% gain during September, the Conference Board reported. The decline ran counter to Consensus expectations for an increase to 107.9. During the last [...]
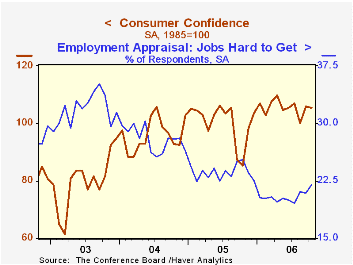
Consumer confidence in October eased 0.5% to 105.4 following an upwardly revised 5.7% gain during September, the Conference Board reported. The decline ran counter to Consensus expectations for an increase to 107.9.
During the last twenty years there has been a 52% correlation between the level of consumer confidence and the y/y change in real consumer spending. The correlation rose to 66% during the last ten years.
Consumers' assessment of the present situation fell 2.8% (+15.7% y/y) and reversed most of the revised 3.6% September increase. The percentage of respondents who viewed business conditions as good (28.1%) actually rose to the highest since May but the percentage that viewed jobs as plentiful fell modestly. The percentage that viewed jobs as hard to get (22.0%) rose to the highest level this year.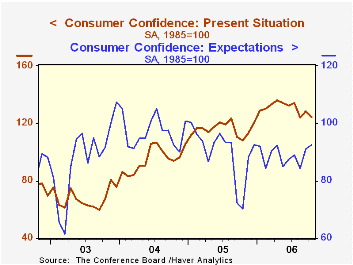
The index measuring consumers' expectations added to its sharp September rise with a 1.8% increase (32.1% y/y). Expectations of better business conditions in six months rose to the highest (18.5%) since last November and more respondents expected more jobs (15.2%).
The expected inflation rate in twelve months was stable at 4.9%, the lowest since March.
The Conference Board’s survey isconducted by a mailed questionnaire to 5,000 households and about 3,500 typically respond.
| Conference Board | October | September | Y/Y | 2005 | 2004 | 2003 |
|---|---|---|---|---|---|---|
| Consumer Confidence | 105.4 | 105.9 | 23.7% | 100.3 | 96.1 | 79.8 |
by Tom Moeller October 31, 2006
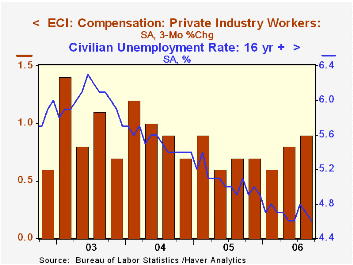
The employment cost index for private industry workers increased 0.9% last quarter, as expected, following the unrevised 0.8% increase during 2Q. Both increases were up from a 0.6% 1Q gain
The gain raised the year to year increase to 3.02%, the fastest since the second quarter of 2005.
Wages & salary growth moderated slightly to 0.8% following the quick 0.9% rise during 2Q. The year to year rise of 3.1% was the fastest since 2002. Factory sector wages grew a more moderate 0.3% (NSA, 2.3% y/y) but wages in the service-producing industries grew a firmer 1.0% (3.2% y/y), the fastest in three years.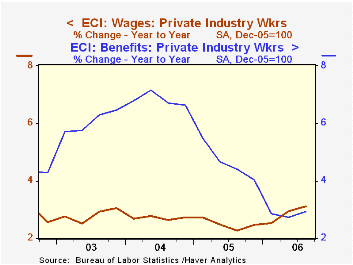
Benefit costs in private industry grew 1.0% reflecting a quickened 1.0% (0.5% y/y) rise in the factory sector and a 1.0% (3.6% y/y) rise in service industries.
The 12-month gain in health insurance benefits eased to 4.9% from a 6.4% increase during 2005 and a 7.3% rise during 2004.
To view the latest release with all the industry detail visit BLS site.
| ECI- Private Industry Workers | 3Q '06 | 2Q '06 | Y/Y | 2005 | 2004 | 2003 |
|---|---|---|---|---|---|---|
| Compensation | 0.9% | 0.8% | 3.0% | 3.0% | 3.7% | 4.0% |
| Wages & Salaries | 0.8% | 0.9% | 3.1% | 2.5% | 2.7% | 3.0% |
| Benefit Costs | 1.0% | 0.7% | 2.9% | 4.0% | 6.6% | 6.5% |
by Tom Moeller October 31, 2006
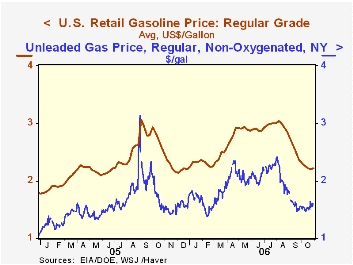
The latest Short-Term Energy Outlook from the U.S. Energy Information Administration is available here.
| Weekly Energy Prices | 10/30/06 | 10/23/06 | Y/Y | 2005 | 2004 | 2003 |
|---|---|---|---|---|---|---|
| US Retail Gasoline Price, Regular | $2.22 | $2.21 | -10.6% | $2.27 | $1.85 | $1.56 |
by Tom Moeller October 31, 2006
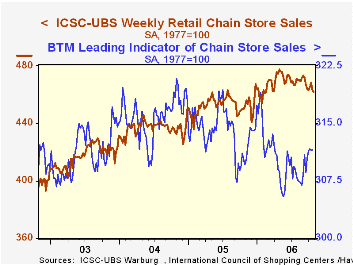
The ICSC-UBS retail chain-store sales index is constructed using the same-store sales (stores open for one year) reported by 78 stores of seven retailers: Dayton Hudson, Federated, Kmart, May, J.C. Penney, Sears and Wal-Mart.
The leading indicator of chain store sales from ICSC-UBS was unchanged 0.4% y/y) last week after a 0.1% slip during the prior period.
| ICSC-UBS (SA, 1977=100) | 10/28/06 | 10/21/06 | Y/Y | 2005 | 2004 | 2003 |
|---|---|---|---|---|---|---|
| Total Weekly Chain Store Sales | 461.8 | 462.9 | 2.3% | 3.6% | 4.7% | 2.9% |
by Louise Curley October 31, 2006
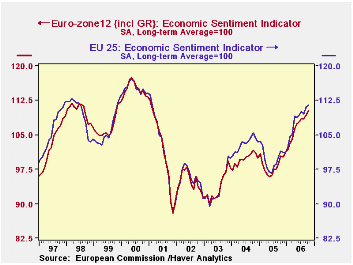
Economic sentiment in the Eurozone increased 0.9% in October to 110.3 and was 9.9% above October, 2005. For the 25 members of the EU (European Union) the comparable figures were 0,5% 111.5 and 9.9% respectively.
The Economic Sentiment Indicator is so designed that 100 represents the long term average. Values above 100 indicate above average sentiment and those below, below average sentiment. The index is a composite of indicators representing industry (40%), service (30%), consumer (20%), construction (5%), and retail (5%). The Euro Zone and EU indicators have been above the long term average since late 2005 and are currently at their highest levels since February, 2001 as can be seen in the first chart.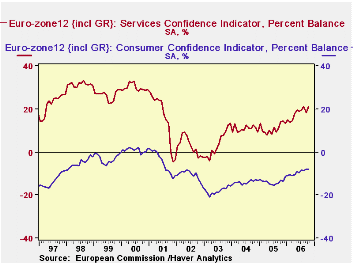
The components of the indicator are expressed in terms of the percent balances between those reporting increases and those reporting decreases. In the Euro Zone, with the exception of construction, all the percent balances of the components increased in October. Sentiment has been highest among those engaged in the service industry and lowest among consumers. In October the percent balance was 20.8% in the service industry while, in the case of the consumer, the percent balance was -7.8%. The second chart contrasts the percent balances in the consumer and service components. Actually the only time the consumer component of the index has shown a positive percent balance during the 21 years that the data have been available was in 2000 and early 2001.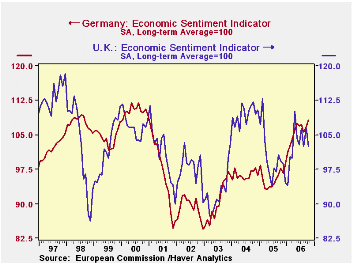
In addition to reporting on the Euro Zone and EU aggregates, the European Commission provides data on each of the countries within the EU. While the Economic Sentiment Indicator for Europe as a whole continued to improve in October, there were diverse trends among the individual countries. In German and France, for example, the indicator rose 1.2% and 1.5% respectively while in Italy and the U. K. the indicators declined 0.6% and 3.8% respectively. The third chart compares the Economic Sentiment Indicators of Germany and of the U.K. Confidence in the U. K. has faltered in recent months while that in Germany has continued to improve.
| Oct 06 | Sep 06 | Oct 05 | M/M % | Y/Y % | 2005 | 2004 | 2003 | |
|---|---|---|---|---|---|---|---|---|
| EURO ZONE | -- | -- | -- | -- | -- | -- | -- | -- |
| Economic Sentiment Indicator (Lt avg =100) |
110.3 | 109.3 | 100.4 | 0.91 | 9.86 | 98.4 | 99.8 | 93.7 |
| Industry (% balance) | 5.2 | 4.4 | -5.7 | 0.8* | 10.9* | -7.3 | -4.7 | -10.3 |
| Service (% balance) | 20.8 | 18.4 | 14.0 | 2.4* | 6.8* | 11.0 | 10.8 | 3.9 |
| Consumer (% balance) | -7.8 | -8.0 | -13.2 | 0.2* | 5.4* | -13.8 | -13.9 | -18.0 |
| Construction (% balance) | 2.5 | 4.1 | -5.0 | -1.6* | 7.5* | -6.8 | -11.8 | -16.0 |
| Retail (% balance) | 3.7 | 3.3 | -5.2 | 0.4* | 8.9* | -7.5 | -8.3 | -9.7 |
| Economic Sentiment Indicator (Lt avg =100) |
-- | -- | -- | -- | -- | -- | -- | -- |
| European Union | 111.5 | 111.0 | 101.5 | 0.45 | 9.85 | 99.9 | 103.0 | 93.8 |
| Germany | 108.1 | 106.8 | 97.7 | 1.22 | 10.64 | 95.6 | 96.3 | 90.6 |
| France | 110.1 | 108.4 | 104.5 | 1.48 | 5.26 | 103.2 | 106.6 | 97.4 |
| Italy | 112.5 | 113.2 | 102.4 | -0.62 | 9.86 | 98.6 | 99.0 | 98.4 |
| United Kingdom | 102.5 | 106.5 | 99.4 | -3.76 | 3.12 | 100.1 | 109.5 | 92.7 |

Tom Moeller
AuthorMore in Author Profile »Prior to joining Haver Analytics in 2000, Mr. Moeller worked as the Economist at Chancellor Capital Management from 1985 to 1999. There, he developed comprehensive economic forecasts and interpreted economic data for equity and fixed income portfolio managers. Also at Chancellor, Mr. Moeller worked as an equity analyst and was responsible for researching and rating companies in the economically sensitive automobile and housing industries for investment in Chancellor’s equity portfolio. Prior to joining Chancellor, Mr. Moeller was an Economist at Citibank from 1979 to 1984. He also analyzed pricing behavior in the metals industry for the Council on Wage and Price Stability in Washington, D.C. In 1999, Mr. Moeller received the award for most accurate forecast from the Forecasters' Club of New York. From 1990 to 1992 he was President of the New York Association for Business Economists. Mr. Moeller earned an M.B.A. in Finance from Fordham University, where he graduated in 1987. He holds a Bachelor of Arts in Economics from George Washington University.


